“Every banker knows that if he has to prove he is worthy of credit, however good may be his arguments, in fact his credit is gone.”
“A banker knows that if he has to prove he is worthy of credit, however good his arguments may be, in fact his credit is gone.”
- Walter Bagehot, Lombard Street (1873)
If there is a "bible" for the art of saving the financial system from a liquidity crisis, Walter Bagehot's Lombard Street is the bedside book for monetary policymakers.
Some Fed programs appear so quietly that the market barely notices. No major press conferences. No emergency announcements. No name catchy enough to make headlines.
Until a line item on the balance sheet begins to swell.
And the old question immediately returns:
Is the Fed doing QE again?
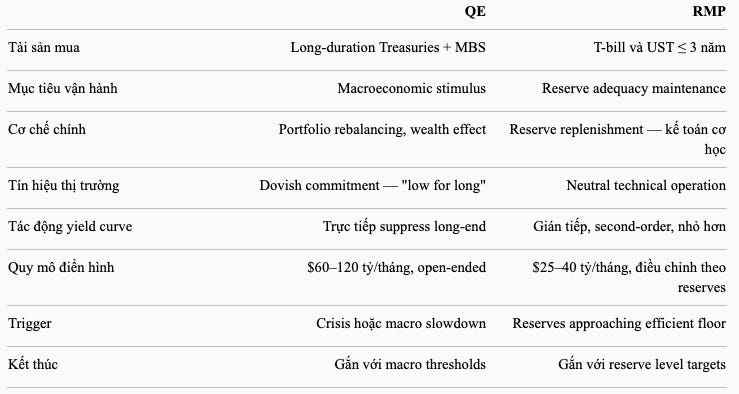
Since mid-December 2025, the Federal Reserve has reactivated Reserve Management Purchases - RMP. Technically, this is a T-bill purchase program, initially around $40 billion per month, then reduced to around $25 billion, with the official goal of maintaining reserves in the "ample" range.
But the market rarely reads the Fed in technical terms.
Once the Fed buys securities, the balance sheet expands. Once the balance sheet expands, memories of QE immediately return. And from there, a familiar narrative is built:
The Fed is quietly easing again.
The Fed is rescuing the Treasury market.
The Fed is helping the Treasury issue debt more easily.
The Fed says this is not QE - but in the end, it is still QE by another name.
This narrative sounds highly plausible. It has all the compelling pieces: T-bill purchases, rising reserves, a larger Fed balance sheet, a US government issuing massive amounts of debt, and a bond market increasingly in need of a marginal buyer.
In an era where everything is read through the lens of fiscal dominance, it is very easy to view RMP as further proof that the Fed cannot exit the market.
But the problem is: that reading is not entirely wrong - it is just not deep enough.
RMP is not QE in the traditional sense. The Fed is not buying long duration to pull the 10Y yield down. The Fed is not trying to create a wealth effect. The Fed is not sending a "low for long" signal. The Fed is not forcing investors out of long-term Treasuries into equities, credit, or real estate.
But saying RMP is not QE does not mean it is harmless, neutral, or of no concern.
This is the central paradox of this week's article:
RMP is not QE. But RMP shows why the post-2008 US financial system can no longer operate with a Fed as small as before.
If QE is the story of monetary policy in a crisis, RMP is the story of the post-crisis financial plumbing.
It is not on the main stage, where everyone looks at the 10Y yield, S&P 500, or the dot plot. It is under the floorboards: in SOFR, EFFR, IORB, SRF usage, TGA, ON RRP, dealer balance sheets, and the overnight cash flows that most investors only remember when they start to clog.
September 2019 was the clearest reminder.
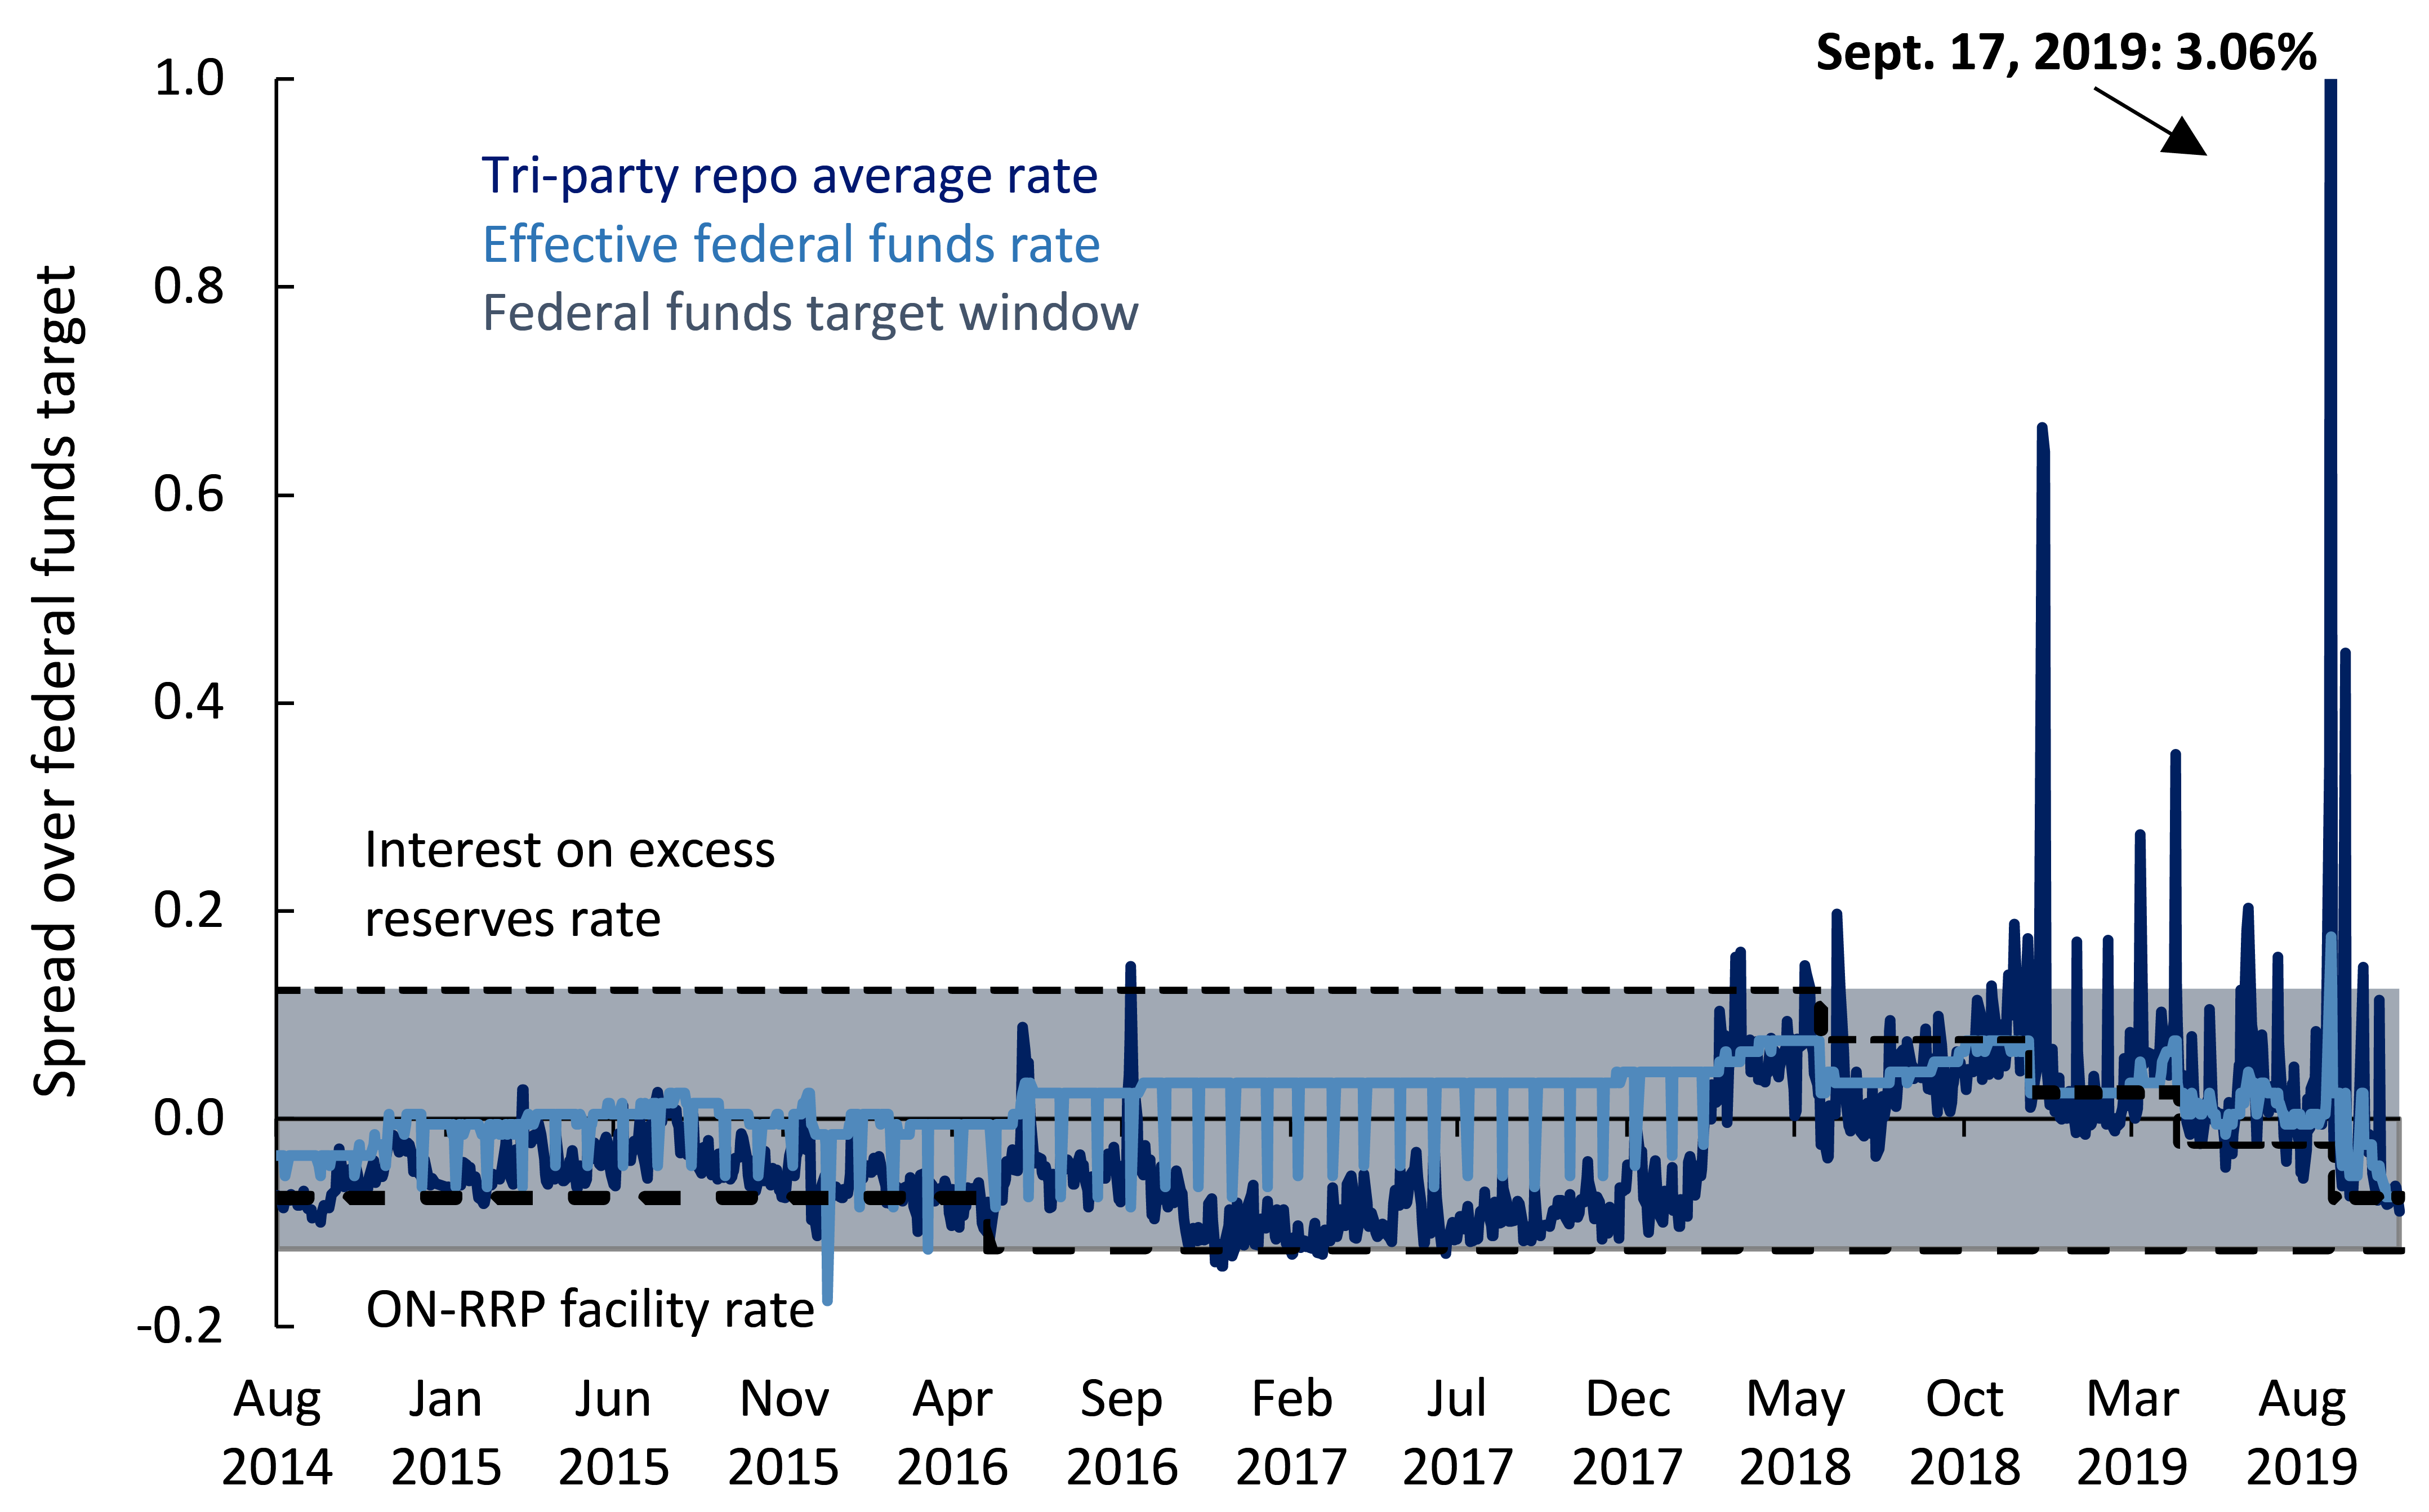
At that time, the US did not lack reserves in an absolute sense. The system still had over $1 trillion in reserves. But the money was in the wrong place, just as the Treasury drained cash into the TGA, tax payments came due, and dealer balance sheets lacked flexibility. The repo market - the quiet heart of the dollar system - suddenly saw pressure build. Overnight rates spiked. A small section of pipe in the basement almost shook the entire building.
The Fed has not forgotten that lesson.
And that is why RMP is back.
Not because the system is broken. Not because the Fed wants to start a new round of QE. But because in a world of ample reserves, the most dangerous thing is not a lack of money in an aggregate sense. The danger is thin buffers, misallocation, and stress appearing just when the market thinks everything is fine.
Therefore, the right question is not just:
“Is RMP QE?”
The better question is:
“If RMP is not QE, why does the Fed still have to buy T-bills just to keep the system running normally?”
And the more important question for the market is:
“If every time reserves approach the scarce zone, the Fed has to halt QT or restart purchases, can the Fed's balance sheet ever truly normalize?”
This week's article goes through six levels of analysis:
Part I - Re-reading the US liquidity map: from pre-2008 scarce reserves to post-QE ample reserves, and why "ample" does not mean "abundant".
Part II - RMP is not QE: differing in assets purchased, objectives, transmission mechanisms, and policy signals - but not entirely harmless because of that.
Part III - What the funding market is saying: why the 10Y yield is the wrong measure for reserve adequacy, and why SOFR, EFFR, IORB, and SRF usage are the real pressure gauges.
Part IV - Why the Fed's balance sheet is unlikely to return to pre-2008 levels: a larger TGA, regulations making reserves more valuable, a broader global role for the USD, and the fiscal deficit exerting gravity on the system.
Part V - The Warsh Era: a Fed Chair who wants to shrink the Fed, but must operate within a system with its own physical forces.
Part VI - Questions RMP does not answer: is the Fed helping the Treasury too much, who bears the cost of Fed losses, and which dashboard investors should monitor weekly.
The purpose of this article, by the end, is that the answer will not be as simple as a headline.
RMP is not QE. But RMP is also not just an innocuous accounting exercise.
It is a sign of a changed system: one where the Fed is not just a rate setter, but also the keeper of the minimum water level for the entire dollar plumbing. A system where Treasury issuance, repo leverage, regulation, and global dollar demand together pull the Fed's balance sheet into a larger role than anyone before 2008 could have imagined.
The risk, therefore, does not lie in the Fed "printing money" in the simple sense.
The risk lies in the fact that the US financial system has become too large, too interconnected, and too dependent on a sufficiently high level of reserves - to the point that if the Fed withdraws too quickly, the plumbing could cry out before the market even understands what is happening.
Viet Hustler is a reader-supported publication. To receive new posts and support my work, consider becoming a free or paid subscriber.
PART I - RE-READING THE MAP: HOW THE US LIQUIDITY SYSTEM OPERATES
To understand RMP, one must first correctly read the US liquidity map.
Before 2008, the Fed operated in a world of scarce reserves: where even a small change in reserves could cause overnight interest rates to fluctuate sharply.
After QE, the system transitioned to ample reserves: reserves are much larger, and the Fed controls interest rates primarily through IORB and ON RRP, meaning a "floor system" rather than injecting/draining reserves daily.
Therefore, RMP can only be properly understood within this new framework. It is not a traditional round of QE, but a tool to keep the system in the ample range - sufficient liquidity to prevent the plumbing from clogging.
In short: before asking “Is RMP QE?”, one must understand that the Fed is currently operating on a completely different monetary map than before 2008.
1.1. Two eras, two different logics
Before 2008, the US banking system operated under a Scarce Reserve Framework - a world where reserves were a scarce resource. Total system-wide reserves were at a very low level, close to reserve requirements. Banks did not want to hold excess reserves because the Fed did not pay interest on reserves at the time. If they fell short of reserves at the end of the day, they had to borrow from other banks in the fed funds market.
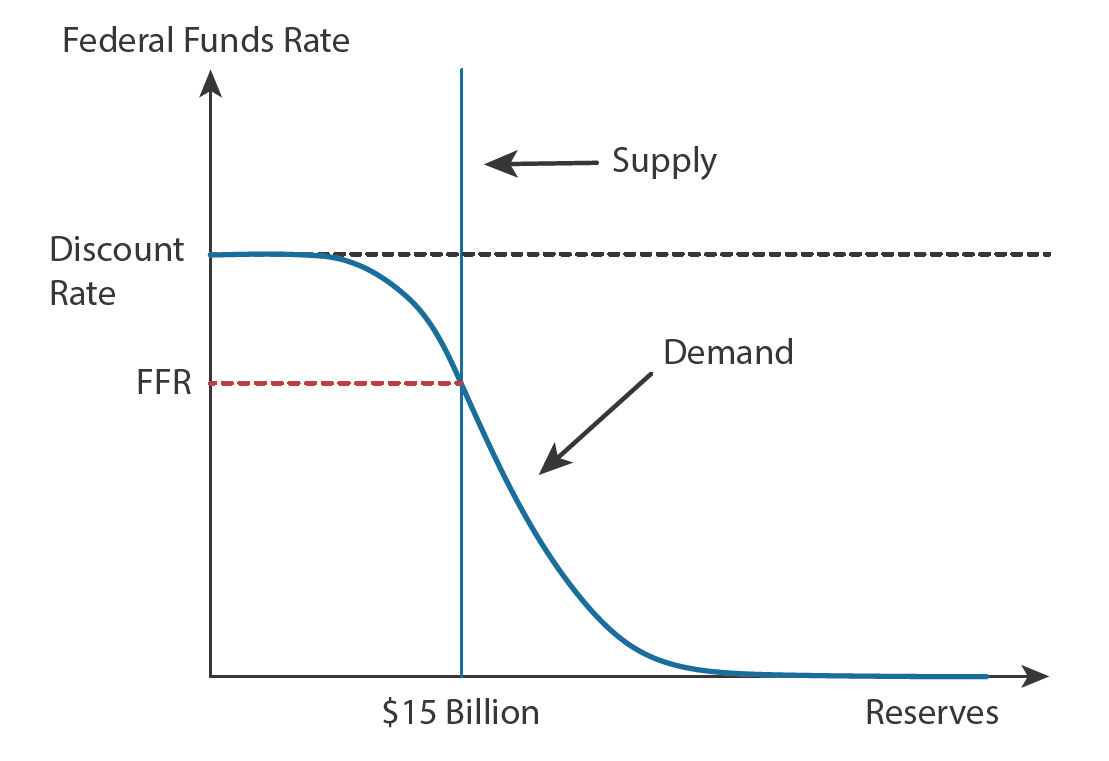
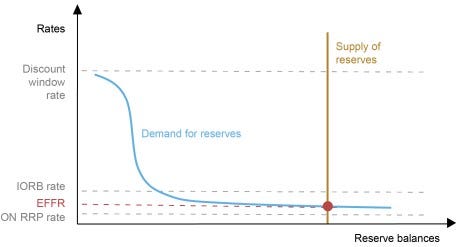
Scarce reserve framework - when reserves are low, interest rates are highly sensitive to supply and demand
This chart shows the Fed's operating logic before 2008. The reserve supply curve is nearly vertical because the Fed controls the amount of reserves in the system. The reserve demand curve is very steep in the scarce region. Thus, even if the Fed injects or drains a small amount of reserves, the equilibrium point in the fed funds market can shift significantly.
That is why the NY Fed Desk had to conduct frequent open market operations back then. To lower the fed funds rate, the Fed bought securities to inject reserves. To raise the fed funds rate, the Fed drained reserves from the system. In this world, the Fed controlled interest rates primarily through the quantity of reserves.
The logic of the system is quite intuitive:
Reserves are scarce.
Because they are scarce, reserves have value.
Because reserves have value, the fed funds market is highly active.
Because the market is sensitive to reserves, the Fed can control interest rates through quantity.
But because of this, the system is highly fragile. A drain of funds into the Treasury's TGA, an unexpected large payment flow, or a sudden drop in confidence among banks can quickly spike overnight rates. In a system where everyone holds only minimum reserves, a shortage of funds at just one link can strain the entire network.
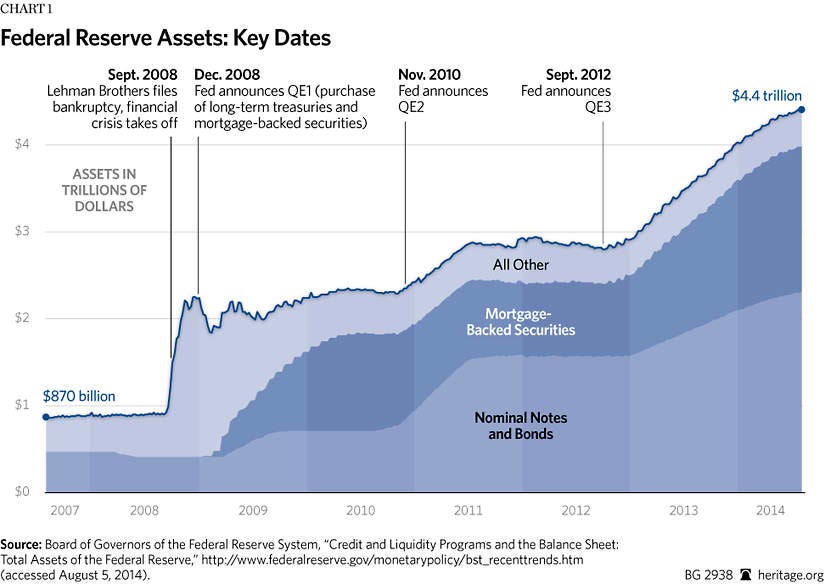
After 2008, everything changed. The Fed implemented QE, purchasing large amounts of Treasuries and MBS, and paying for them by crediting reserves to the banking system. Reserves grew from a tiny amount before the crisis to trillions of dollars after rounds of QE. Once the "reserve pool" became a massive lake, the old method of control was no longer as effective.
Before 2008, injecting a few billion dollars of reserves could move the fed funds rate. After QE, with trillions of dollars of reserves in the system, injecting or draining a few billion dollars is no different from pouring a bucket of water into a large lake. The Fed therefore had to shift from controlling interest rates through "quantity" to controlling them through "price".
That is Ample Reserve Framework, operating through a floor system. The two central tools are IORB and ON RRP.
IORB (Interest Rate on Reserve Balances) is the interest rate the Fed pays on commercial bank reserves.
ON RRP (Overnight Reverse Repurchase Agreements) is the interest rate the Fed pays on overnight cash from money market funds and non-bank institutions.
These two tools create an anchor zone for short-term interest rates.
The mechanism is very simple: if market rates are lower than IORB, banks have a reason to keep their money at the Fed instead of lending it out at lower yields. If the non-bank sector has too much cash, money market funds can park their money in ON RRP instead of accepting excessively low market rates. As a result, the Fed does not need to inject or drain reserves daily as before; the market naturally anchors itself around the rate floor set by the Fed.
In other words, the Fed has shifted roles. Before 2008, the Fed was like someone regulating daily water flows in a small canal system. After 2008, the Fed is like the designer of the floor water level for a massive reservoir.
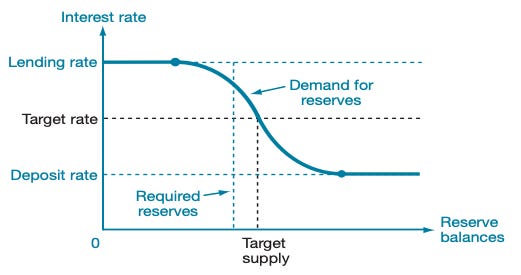
This chart is the simplest way to understand the post-2008 shift. When reserves were scarce, the demand curve was very steep: just a small change in supply could cause overnight rates to fluctuate wildly. This was the world of the scarce reserve framework-where the Fed controlled rates by injecting or draining small amounts of reserves.
But when reserves grow large enough, the system enters the flat portion of the demand curve. At this point, adding or subtracting a small amount of reserves no longer significantly changes interest rates. Rates are anchored near the floor-namely the deposit rate / IORB. This is the core logic of the ample reserve framework.
The issue lies in the transition zone. If reserves are excessive, the system is abundant: rates sit comfortably near the floor. If reserves are drained close to the steep part of the demand curve, funding rates become more sensitive, with SOFR and EFFR approaching or exceeding IORB. This is the zone the Fed wants to avoid. RMP is therefore not "stepping on the gas" like QE, but rather the Fed's way of keeping the reserve supply from sliding from the ample zone into the scarce zone.
→ From this chart, the most important point is: "ample" is not "abundant." Both lie to the right of the scarce zone, but one represents comfortable excess, while the other is merely sufficient with a thinner buffer.
1.2. "Ample" is not "Abundant"
This is the point most people get wrong in the RMP debate: a system can still have plenty of reserves in absolute terms, but it is no longer "flooded with cash" as before.
In the Fed's terminology, we must distinguish between three different states: abundant, ample, and scarce. These three states differ not only in the quantity of reserves, but more importantly, in how money market rates react when reserves are drained from the system.
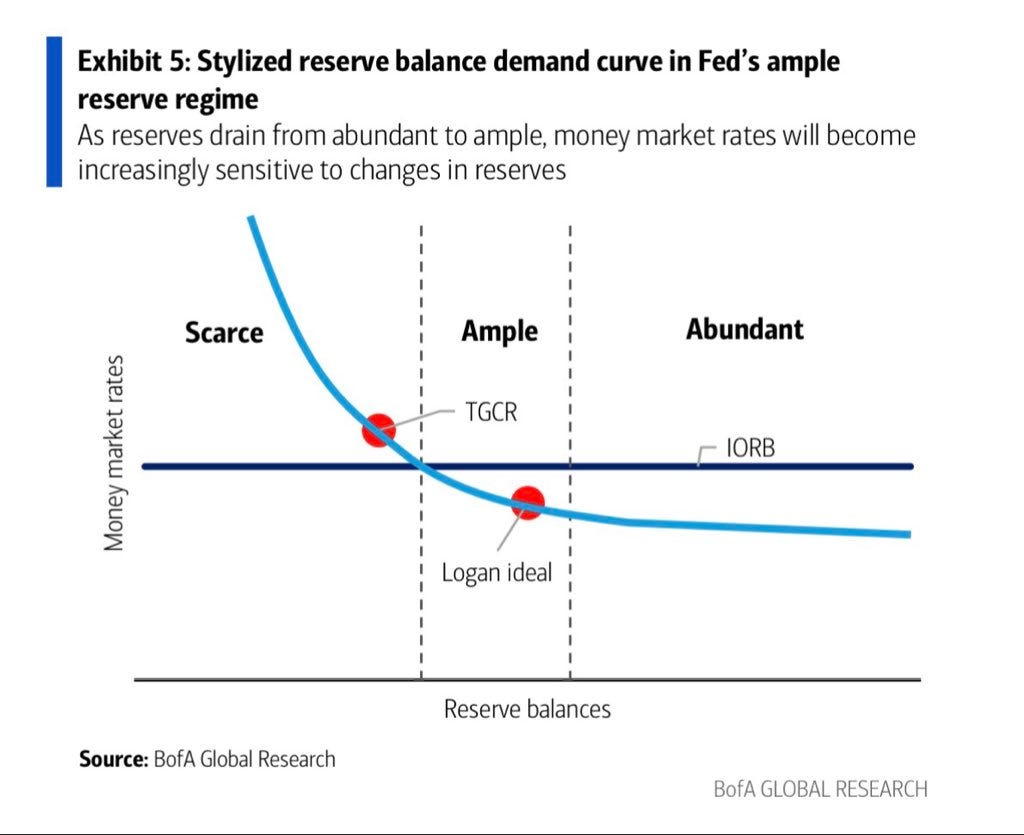
Chart: Reserve demand curve and the "efficient floor" of the ample reserves system
Specifically, this chart is the Fed's simplest liquidity map. The horizontal axis is reserve balances - the volume of bank reserves in the system. The vertical axis is money market rates - short-term interest rates such as TGCR, SOFR, or EFFR. The blue line is the reserve demand curve. When reserves are far to the right, the demand curve is almost flat. But as reserves are gradually drained to the left, the demand curve begins to bend upward, then becomes very steep in the scarce zone.
To put it simply: when there is plenty of water in the lake, removing a few buckets goes unnoticed. But when the water level approaches the operational bottom, every bucket withdrawn causes a noticeable change in pressure.
In the Abundantzone, reserves are highly abundant. The system has so much short-term cash that TGCR and SOFR typically sit visibly below IORB. This was the state during the 2021–2023 period, when ON RRP swelled to trillions of dollars because money market funds had no better place to park cash than back with the Fed overnight. In this zone, the buffer is very thick. The Fed injecting or draining another few tens of billions of dollars usually does not create major volatility.
In the Amplezone, reserves are still sufficient for the system to run smoothly, but they are no longer comfortably excessive. Banks still settle transactions normally, the repo market remains active, and no one has to borrow reserves at an emergency premium. However, funding rates begin to be more sensitive. TGCR, SOFR, or EFFR move closer to IORB. This is the zone the Fed wants: enough water to keep the pipes running, but not so much that cash sits idle across the system.
In the Scarcezone, reserves begin to run short. This is the steep part of the demand curve. A single liquidity drain from the TGA, tax payments, or Treasury issuance can quickly spike money market rates. When TGCR or SOFR exceeds IORB, it is a sign that the market is paying a premium to borrow cash, meaning the floor system is starting to strain. This is the zone the Fed wants to avoid, as repo stress can emerge very quickly.
This can be summarized as follows:
Abundant: excess cash, rates sit comfortably below IORB, very thick buffer.
Ample: sufficient cash, rates closer to IORB, system is stable but buffer is thinner.
Scarce: cash begins to run short, rates can exceed IORB, funding market is strained.
The "Logan ideal" point on the chart is very important. It accurately describes the state the Fed wants to target: not returning to the abundant era, where ON RRP swelled to trillions of dollars; but also not letting reserves slide into scarce territory, where the repo market could clog up due to a sudden liquidity drain.
When Lorie Logan says money market rates have risen, and sometimes exceeded IORB, she is not describing a system "comfortably flooded with cash." It is a signal that reserves have approached the efficient floor zone-where every additional dollar of reserves begins to have real value. In other words, the system is not broken, but it is close enough to the boundary that the Fed must be cautious.
This is also why the Fed does not want to push QT too deep. The lesson of September 2019 remains: when reserves are drained too close to the scarce zone, the aggregate figure may still look large, but the underlying plumbing has already begun to weaken. At that point, if Treasury issuance, tax payments, and dealer balance sheet constraints hit simultaneously, repo rates can spike.
The lesson of 2019 is not that "reserves must equal a specific number to be sufficient." The lesson is: the aggregate figure does not tell the whole story. What matters is where reserves sit on this demand curve-whether they are still in the ample zone or have approached the steep part of the scarce zone.
Therefore, RMP sits right at this juncture. It is not an effort to return the system to the abundant state of 2021–2023. Nor is it QE to pull down long-end yields. It is the Fed's way of keeping the supply of reserves from sliding too far to the left-where the funding market could shift from stable to strained very quickly.
1.3. Why is the boundary line more important than absolute numbers?
When the Fed says reserves have reached an "efficient" level, it should not be understood as the system being comfortably in excess. "Efficient" here does not mean "flooded with cash." It means reserves have approached the zone where every additional dollar begins to have real value for the funding system.
Reserve demand curve and the "efficient floor" of the ample reserves system
This chart shows how the Fed views the reserve system within a floor system. The horizontal axis is the volume of reserves in the system. The vertical axis is money market rates. When the supply of reserves is far enough to the right, the system operates on the relatively flat portion of the demand curve. Short-term rates like EFFR are anchored around the area between IORB and ON RRP. Adding or subtracting a small amount of reserves barely changes the market.
But if reserves are gradually drained to the left, approaching the curved and steeper part of the demand curve, the story changes. Every dollar of reserves withdrawn becomes more important. Funding rates become more sensitive. Repo rates strain more easily. Banks tend to hoard liquidity more tightly. And a single drain of funds from the TGA, tax payments, or Treasury issuance can cause a strong reaction in the money market.
This is precisely why the "boundary line" is more important than absolute numbers. A system may still have trillions of dollars in reserves, but if the reserve supply stands right next to the steep part of the demand curve, the actual buffer is no longer thick. Conversely, the same amount of reserves that looks large on paper may be insufficient if misallocated just as funding demand rises.
Therefore, when funding rates begin to approach or exceed IORB, the Fed understands that the system is nearing a sensitive zone. The issue is not that the market has broken. The issue is that if QT continues to drain reserves, the system could slide from the ample zone-sufficient-into the scarce zone-starting to become scarce. And once it enters the steep part of the demand curve, stress usually does not increase linearly. It can spike very quickly.
RMP should therefore be read as a defensive move.
It is not that the Fed sees the system as "flooded with cash" and still wants to inject more.
It is not that the Fed is launching a new round of QE to stimulate risky assets.
Rather, the Fed sees that the buffer is thin and wants to keep the reserve supply from sliding too far to the left.
This is the core difference between defense and stimulus. QE is a macro policy: buying duration, pulling down long-end yields, creating a wealth effect, and pushing investors out the risk curve. RMP is a plumbing operation: adding reserves so the funding market does not clog.
In short, RMP is not stepping on the gas. It is like a stability control system when the car is driving close to the edge of the road. The Fed is not trying to return the market to the abundant state of 2021–2023. The Fed only wants to keep the system in the efficient floor zone: enough reserves to keep the dollar pipeline running, but not so excessive as to turn RMP into a disguised round of QE.
1.4. Aggregate ample does not mean ample everywhere
Another misconception is assuming that if total bank reserves across the entire system remain high, then every bank has excess liquidity. The reality is not that simple.
The system can be ample on an aggregate basis (aggregate ample), but still liquidity-strained at specific points (distributionally scarce). From a distance, the water level of the entire lake seems sufficient. But inside, water does not automatically flow evenly to every pipe.
Large banks typically hold more reserves. But that does not mean they are always willing to distribute that surplus elsewhere. They are bound by multiple post-2008 crisis constraints: supplementary leverage ratio (SLR), liquidity coverage ratio (LCR), stress tests (stress tests), interest rate risk in the banking book (IRRBB), and internal balance sheet limits.
Therefore, a globally systemically important bank (G-SIB) may hold large reserves but still be unwilling to expand its balance sheet to lend more in the fed funds or repomarkets. It is not because they lack money, but because additional lending consumes capital, balance sheet capacity, and risk limits.
Conversely, small and medium-sized banks are often the first to feel the strain. They do not always have access to liquidity as quickly and cheaply as large banks. When the market tightens, reserves do not automatically flow from surplus to deficit areas like water in a perfect communicating vessel.
The role of money market funds (money market funds) has also changed. During the period when ON RRP was still large, this was a crucial buffer for the system. When the system had excess cash, these funds could park money back at the Fed through the overnight reverse repo facility (ON RRP), helping to absorb excess liquidity.
Therefore, one cannot simply look at aggregate reserves and conclude that the system has "excess cash." It is necessary to look at plumbing indicators:
Is SOFR below, near, or above IORB?
How many basis points is EFFR from IORB?
Is the SRF used regularly?
Is the FFR–SOFR spread wide or narrow?
Is the ON RRP still a large buffer or is it nearly depleted?
These indicators say much more about actual liquidity conditions than an aggregate reserves figure.
1.5. Three continuous drains on reserves
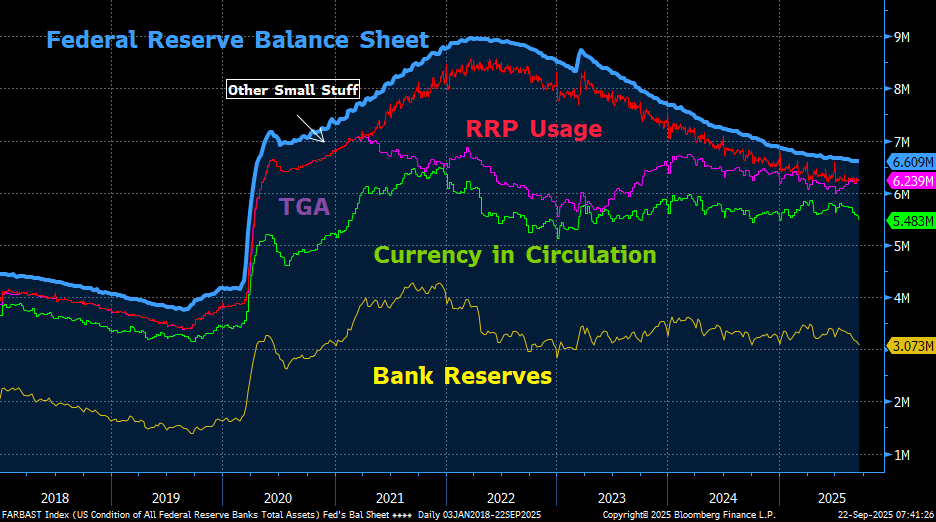
RMP exists because reserves do not stand still. Bank reserves are only a part of the Fed's total liabilities, alongside the TGA, ON RRP, currency in circulation, and other technical items. Therefore, when another "reservoir" swells, reserves are typically pulled down.
The first chart clearly shows this mechanism: the Fed's balance sheet is the sum of multiple liquidity layers. Reserves do not move independently; they are affected by the TGA, RRP usage, currency in circulation, and other items. Simply put, the system is not a static pool of water. It consists of multiple interconnected reservoirs - water flowing into one reservoir can drain from another.
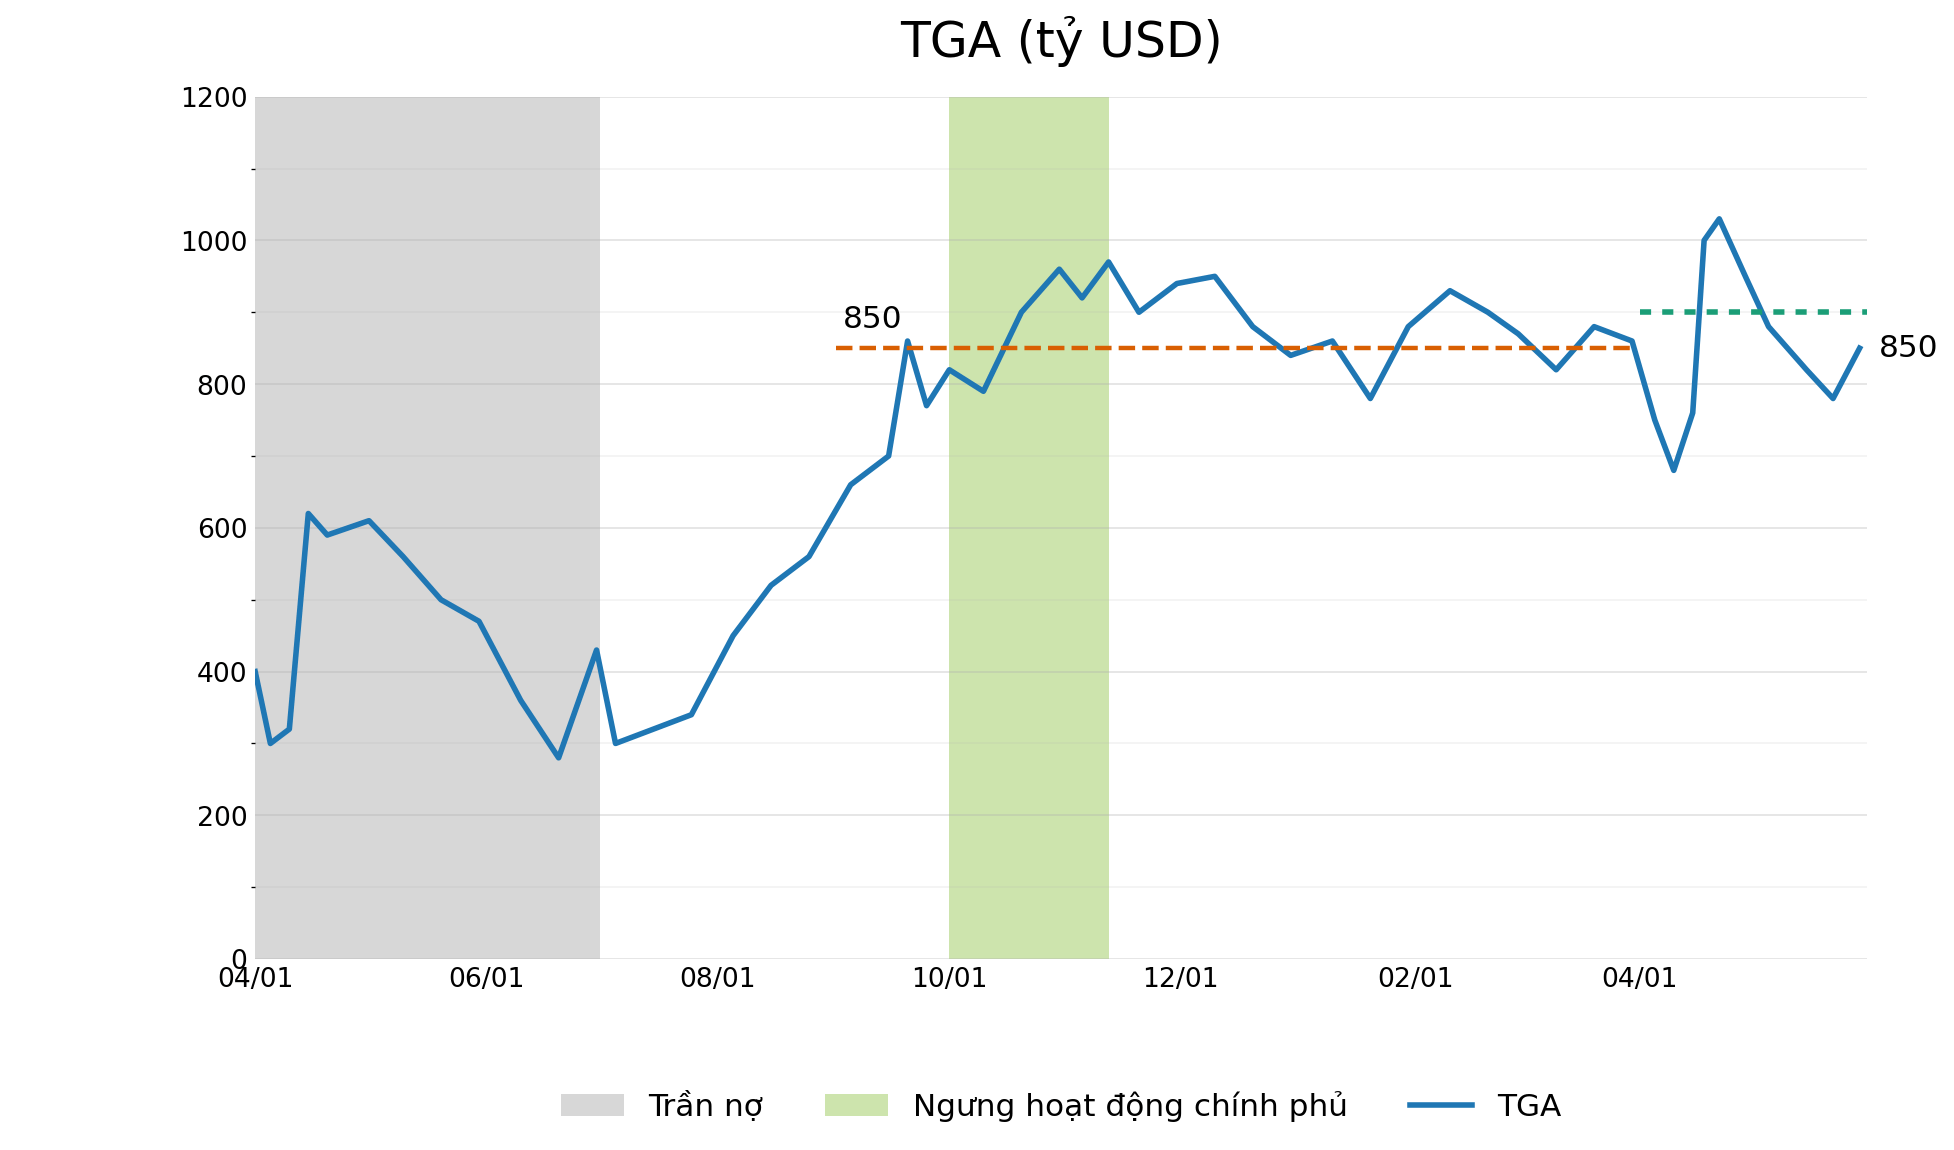
The most important drain is TGA - Treasury General Account. When the Treasury issues debt or collects taxes, money flows into the Treasury's account at the Fed, reducing reserves in the banking system. When the Treasury spends, money flows back into the economy and reserves rise again. The TGA chart shows that this balance can fluctuate wildly around the $850–900 billion range, even spiking above $1 trillion. In an abundant state, the system can absorb these fluctuations. But when the reserve buffer is thinner, a spike in the TGA can make the funding market much more sensitive.
TGA - one of the most important drains on reserves
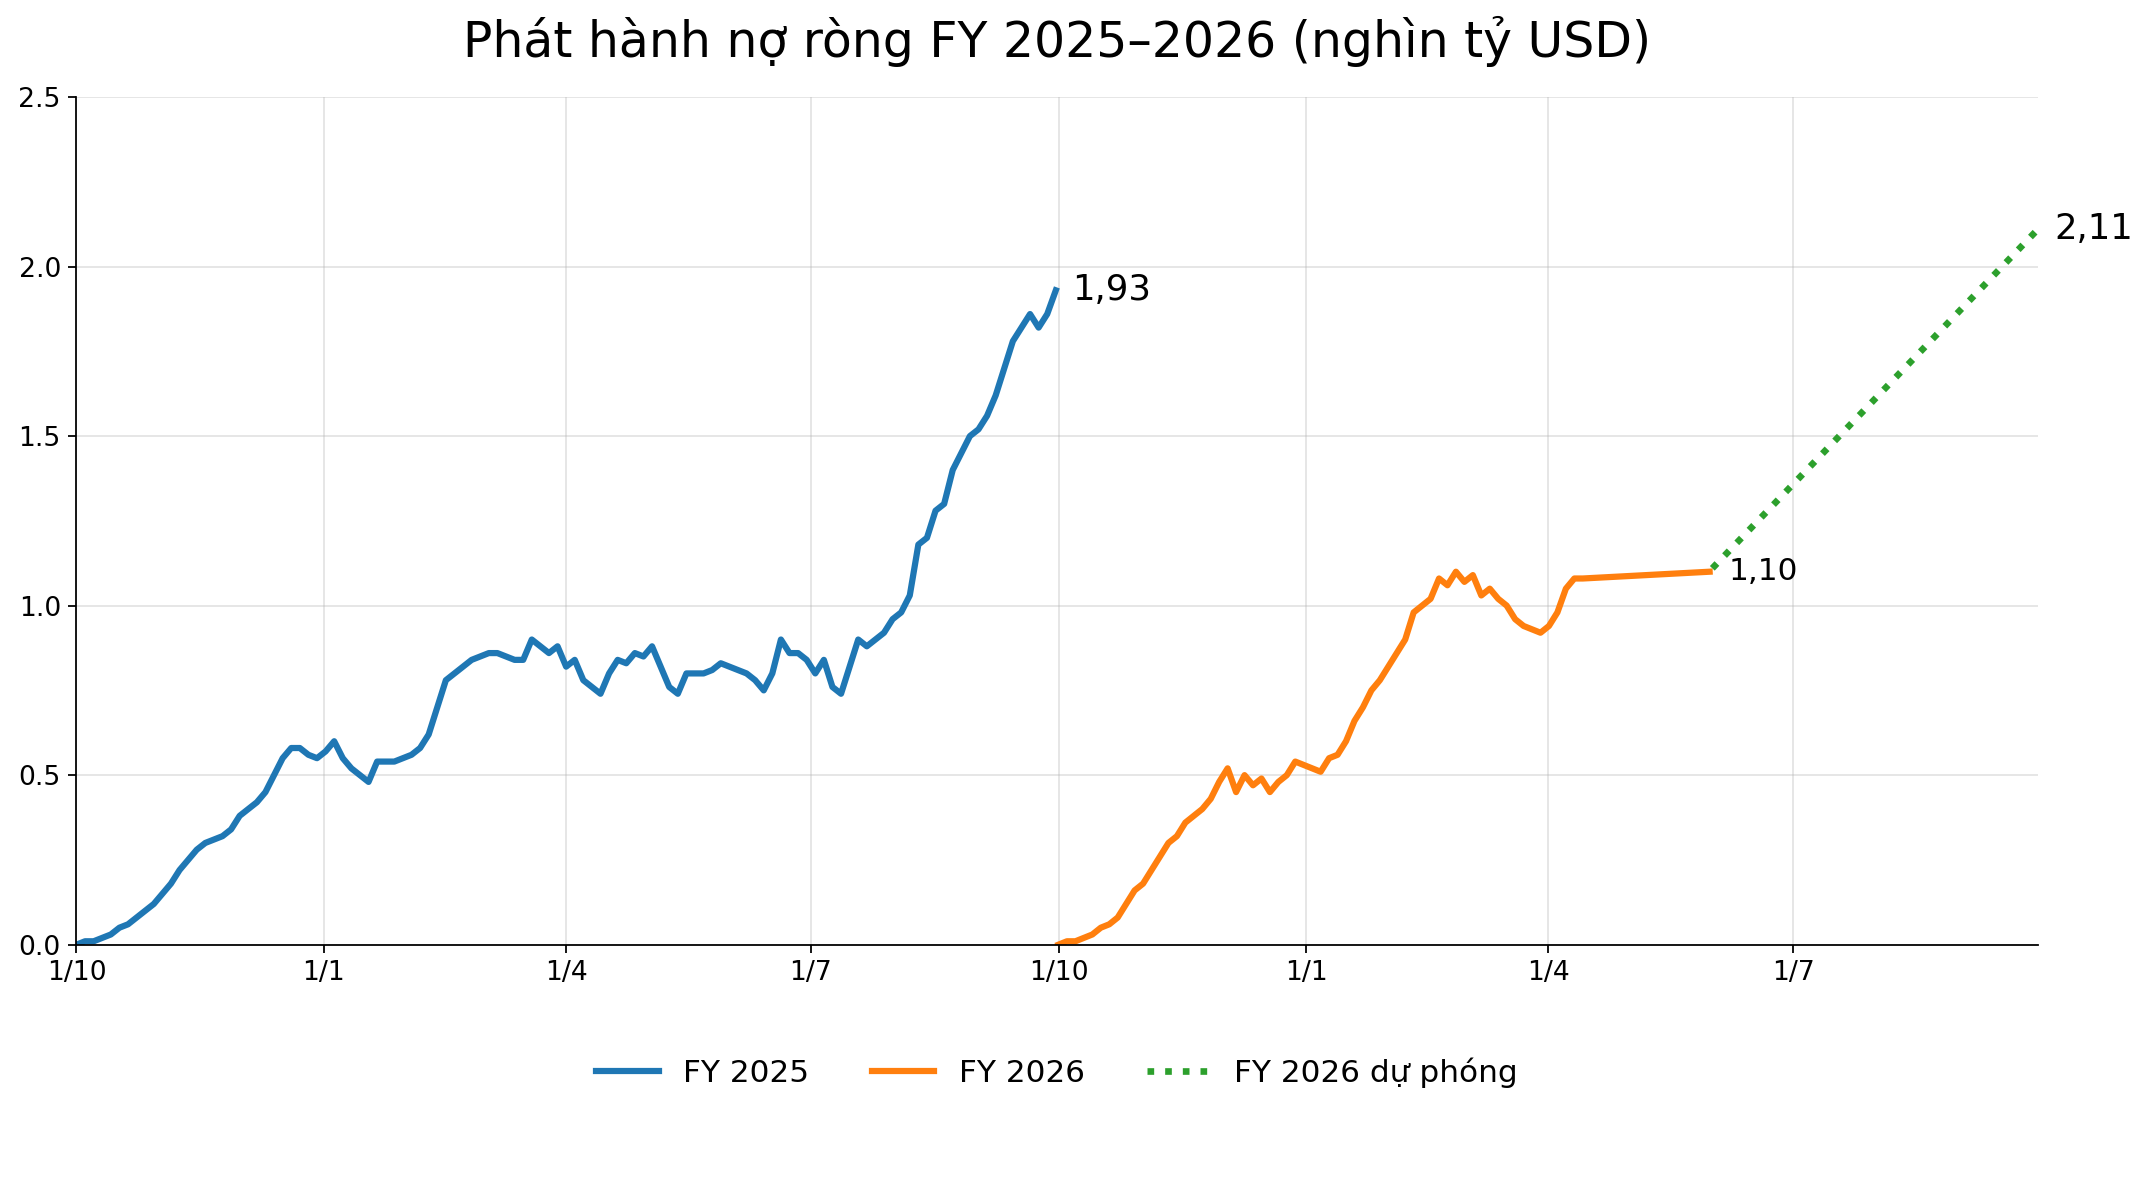
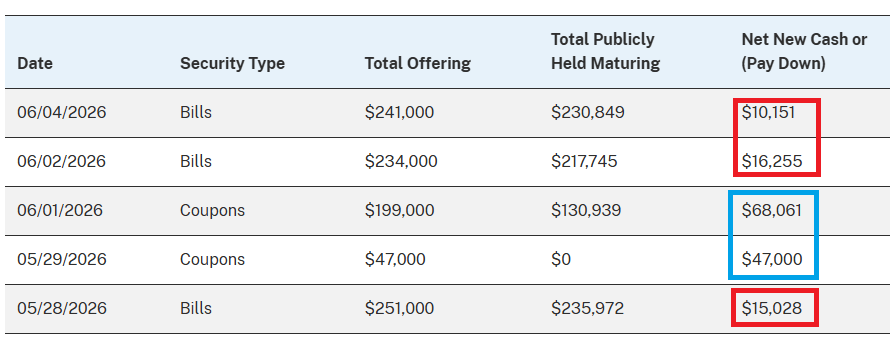
This pressure is compounded because the Treasury still has to issue net debt on a large scale.
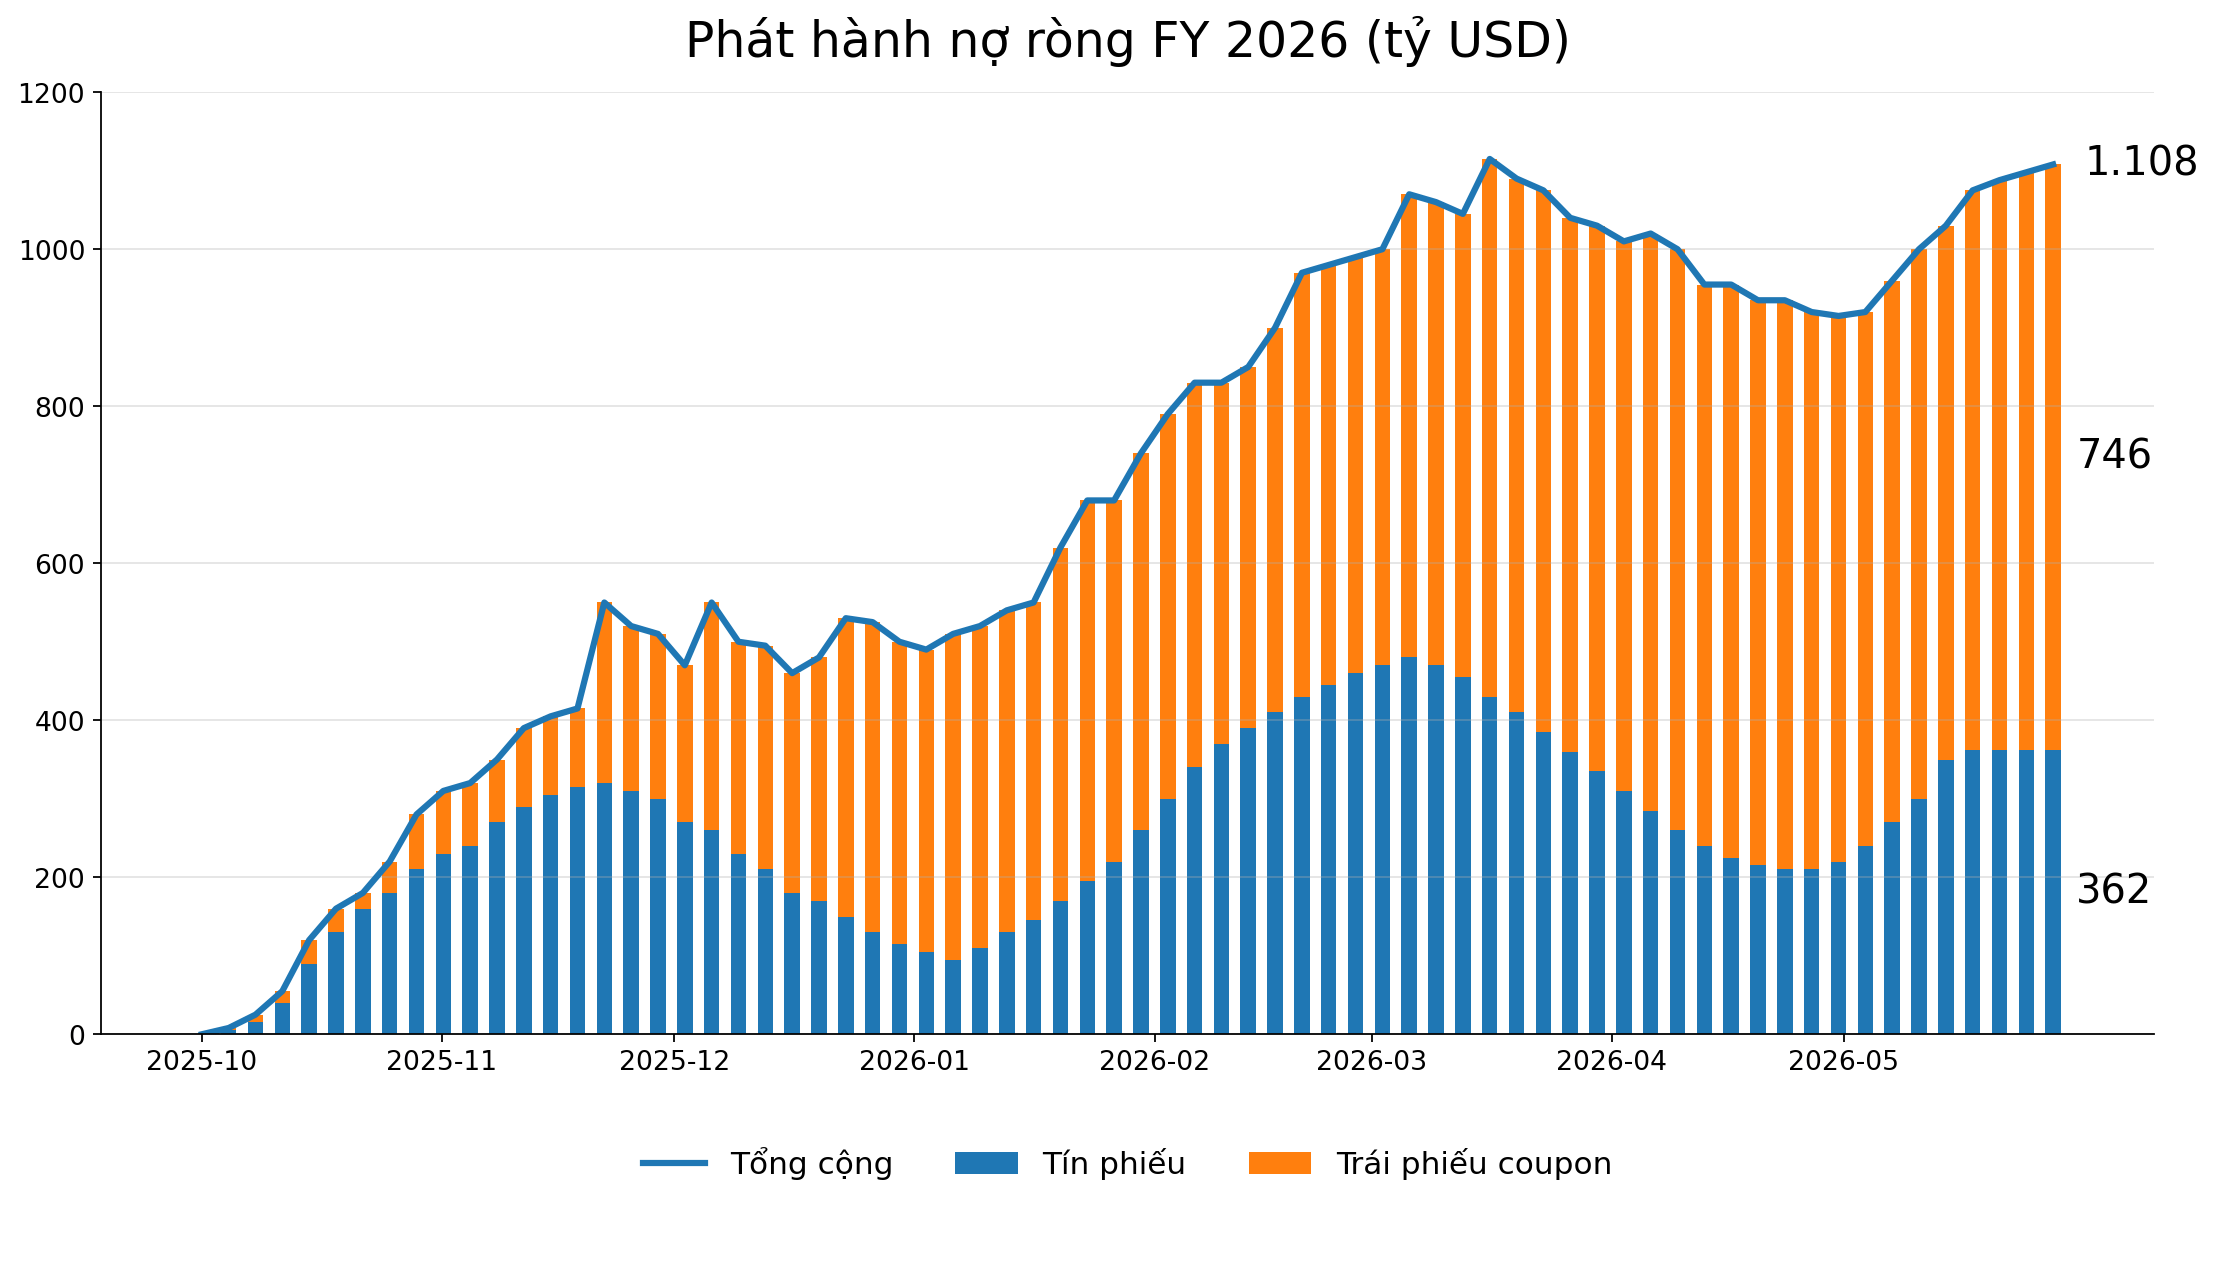
The FY2026 debt issuance chart below shows that total net issuance could exceed $1.1 trillion, with both bills and coupon bonds contributing significantly. This is not just a fiscal story. It is also a liquidity story: each debt issuance pulls money from the private sector into the Treasury, increasing the demand for dealer balance sheets, repo financing, and cash in the money market.
Net debt issuance in FY 2026 - a constant source of pressure on reserves
The second drain is currency in circulation. When individuals and businesses need cash, banks convert a portion of their reserves at the Fed into physical currency. As currency in circulation increases, reserves decrease accordingly. This is the most silent drain: it does not make headlines like Treasury issuance, but it is persistent over time as the nominal economy grows.
The third drain is MBS runoff and technical flows on the Fed's asset side. When mortgage borrowers repay principal, the principal flows back to the Fed. If the Fed does not reinvest, the balance sheet shrinks and reserves are drained. If the Fed reinvests in T-bills or short-term Treasuries, this drain is partially neutralized. However, MBS prepayments are uneven and depend on mortgage rates, which always creates timing friction in reserve management.
These three forces can be summarized as follows:
Treasury issuance / TGA: drains reserves into the Treasury's account at the Fed.
Currency in circulation: converts reserves into cash outside the banking system.
MBS runoff / timing friction: shrinks the balance sheet or causes volatility if not properly reinvested.
The common thread is that all three forces operate largely independently of the Fed's short-term intentions. They act like gravity in the liquidity system: quiet, but always pulling the reserve level down unless countered by an opposing force.
Therefore, RMP should not be understood as a simple "liquidity injection." It is the Fed's response to a system where reserves are constantly pulled back and forth among the TGA, RRP, currency in circulation, and runoff flows. To understand why the Fed is buying more T-bills, one must look at all of these reservoirs - not just the headline "Fed balance sheet expansion."
1.6. Why RMP is a counter-balance, not a stimulus
When placing RMP alongside the drains on reserves, this program becomes easier to understand. The Fed buying T-bills is not necessarily "stepping on the gas" for the economy. In this context, RMP acts like a countervailing force: keeping the reserve level from falling below the safety threshold.
Reserves are constantly eroded by multiple mechanical flows. Treasury issuance drains money into the TGA. Currency in circulation converts a portion of reserves into cash outside the banking system. MBS runoff shrinks the Fed's balance sheet if not reinvested. The depletion of the ON RRP thins the liquidity buffer of money market funds. At the same time, a larger repo market increases the demand for cash for settlement and intermediation.
Simply put: even if the Fed does not announce further tightening, the system can still lose reserves on its own over time.
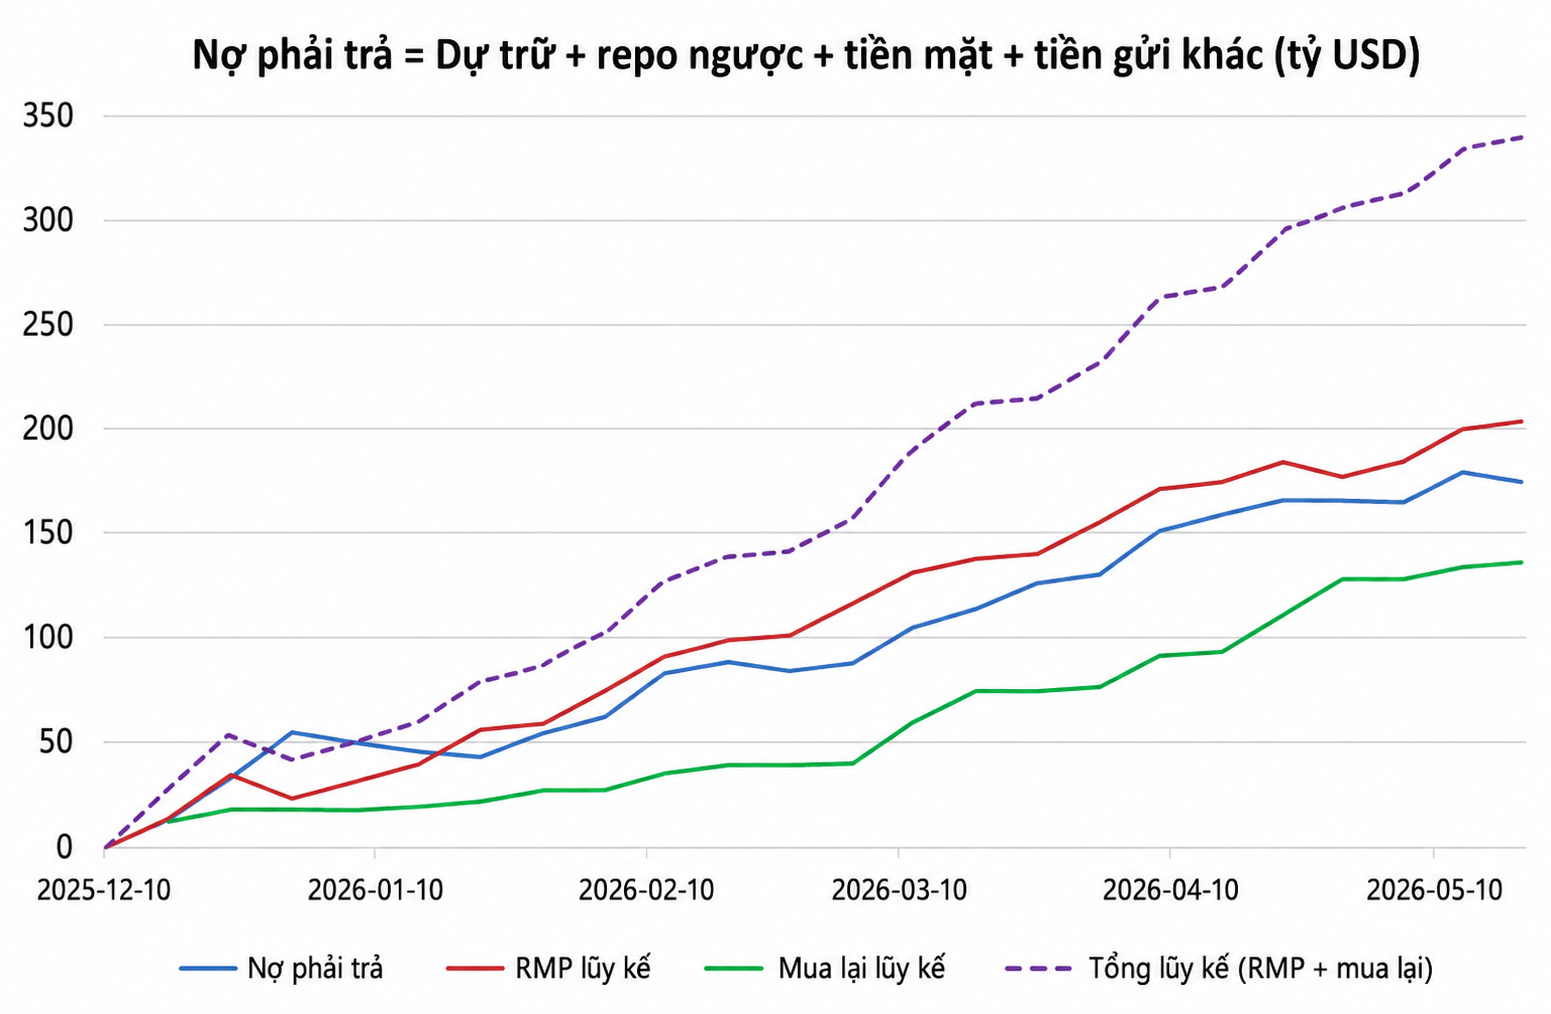
This chart helps put RMP into proper perspective. The cumulative RMP line shows the amount of T-bills purchased by the Fed. The cumulative redemption line reflects additional offsetting flows. The cumulative total line shows that when these flows are placed side-by-side, the Fed is not simply "opening the taps" like QE; it is trying to offset the forces pulling reserves out of the system. This is why the total offsetting force increases gradually alongside liability demand and other liquidity-draining flows.
The core difference lies in the objective. QE is a macro stimulus tool: it buys long duration, pulls down long-end yields, creates a wealth effect, and pushes investors into riskier assets. RMP is much narrower: it buys T-bills to replenish reserves, support settlement, and keep money market plumbing from clogging.
Therefore, RMP should not be read in isolation from the TGA, currency in circulation, ON RRP, MBS runoff, and Treasury issuance. If we only look at the headline "Fed buys securities" and conclude "QE," we only see what the Fed is injecting while ignoring the reserves being drained from other reservoirs.
In short, RMP is not a simple story of "the Fed printing money again to rescue the market." It is a sign that the post-2008 US financial system requires a larger Fed balance sheet just to function normally.
The right question, therefore, is not: "Is RMP QE?"
The better question is: "Why does the current US financial system need the Fed to constantly maintain reserve levels just to keep the dollar plumbing from clogging?"
PART II - RMP IS NOT QE - BUT HOW IMPORTANT IS THIS DISTINCTION?
After understanding why the US liquidity system needs constant "maintenance," the next question is: Is RMP QE? And if the Fed is still buying securities, does that distinction really matter?
The short answer is: RMP is not QE in terms of transmission mechanism, operational objectives, and policy signaling. But the story should not stop there. Because even though RMP is not QE, it still raises a bigger question: why does the current US financial system need the Fed to constantly maintain reserve levels just to keep the plumbing from clogging?
In other words, the debate over "Is RMP QE?" is just on the surface. The deeper question is: how dependent has this system become on the Fed's balance sheet?
There are three layers to unpack:
Technically, RMP is different from QE.
In terms of market sentiment, RMP can still be misread as "QE-lite."
Structurally in the long term, RMP shows that the dollar system requires more of a Fed backstop than before.
2.1. RMP is not a new tool - it has a predecessor in the 2019 repo shock
RMP did not appear out of thin air. Its direct predecessor is the T-bill purchase program following the September 2019 repo shock - a moment when the Fed realized that the balance sheet might have been shrunk too deeply relative to the system's actual plumbing needs.
From 2017 to 2019, the Fed conducted QT: letting assets mature, not fully reinvesting, and gradually withdrawing liquidity from the system. From a distance, this process was quite orderly. The Fed's balance sheet decreased by nearly $700 billion. Reserves in the banking system fell from around $2.8 trillion to about $1.38 trillion.
The problem is: $1.38 trillion still sounds massive. But in a post-2008 financial system, "large" does not mean "enough".
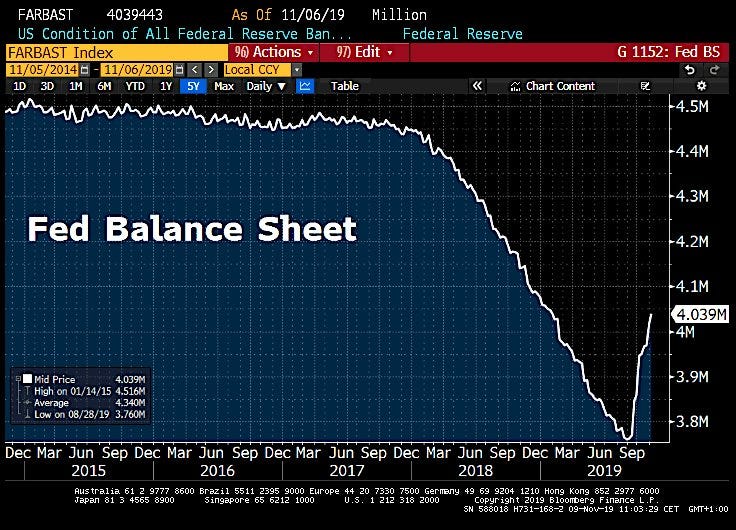
The Fed's balance sheet clearly shows this breaking point. For nearly two years, the Fed drained liquidity from the system while the market remained relatively calm. But by late summer 2019, as the balance sheet neared a level the system could no longer tolerate, the repo market started to push back.
Chart: The Fed tried to drain liquidity from the system - until the repo market pushed back
Following the September 2019 shock, the Fed's balance sheet rebounded. This was not because the Fed wanted to stimulate the economy, but because the funding market signaled to the Fed that reserves had dropped too close to the danger zone.
Looking at the repo rate makes this lesson even clearer. The tri-party repo average rate at one point spiked well outside the stable range of the federal funds target window, while the effective federal funds rate also came under pressure. This was no longer normal technical volatility. It was a signal that overnight cash had suddenly become scarce right where the system needed it most.
That shock did not stem from a single cause. It was the result of multiple liquidity drains occurring simultaneously: QT thinned out reserves, Treasury issuance and tax payments sucked cash into the TGA, while dealer balance sheets lacked the flexibility to absorb repo demand and redistribute liquidity back to the broader system.
The mechanism can be summarized as follows:
QT in 2017–2019 shrank the Fed's balance sheet and caused reserves to drop sharply.
Treasury issuance and tax payments drained more cash into the TGA.
Reserves were dragged down just as funding demand surged.
Dealer balance sheets lacked the flexibility to absorb the shock.
Repo rates spiked, at one point surging from around 2% to nearly 10%.
The key point is that the 2019 repo shock did not happen because the US "ran out of money." It occurred because cash was not in the right place at the right time, with enough of a buffer for the system to absorb the shock. Aggregate reserves still appeared large, but marginal reserves had become scarce.
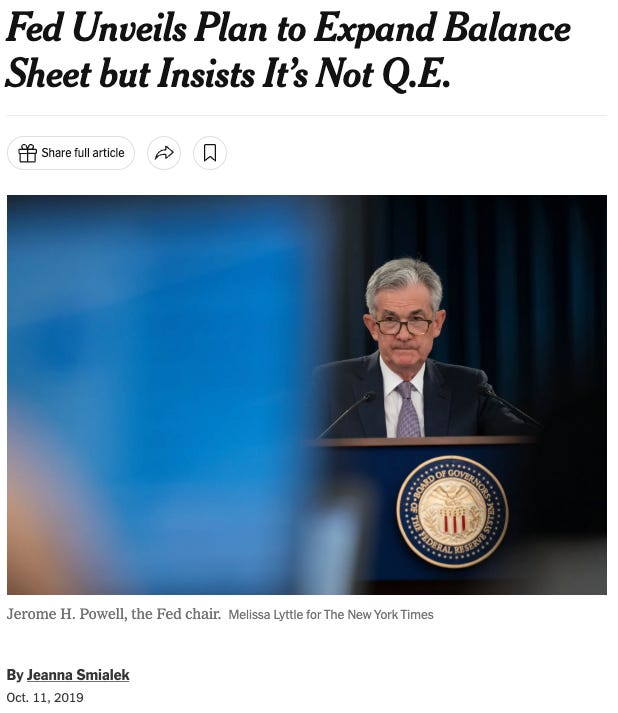
The Fed was forced to react. It began with emergency repo operations to inject overnight liquidity. Later, the Fed launched a T-bill purchase program of about $60 billion per month to replenish reserves in a more structural manner. Powell emphasized at the time: "This is not QE."
From the Fed's perspective, they were not buying T-bills to push down long-term yields. They were not buying duration, not trying to create a wealth effect, and not sending a "low for long" signal like the post-crisis rounds of QE. The goal was much narrower: to bring reserves back to a safe enough level so that the repo market would no longer clog.
In other words, the Fed was not trying to step on the gas for the economy. It was fixing a clogged pipe.
Notably, this program was never fully tested as an independent tool. Just a few months later, COVID-19 struck, forcing the Fed to deploy full-scale QE on a much larger scale. The T-bill purchase program following the 2019 repo shock was swallowed by the 2020 policy flood, leaving the market without a clean data sample to evaluate RMP independently during a normal cycle.
The 2019 lesson is therefore crucial: RMP was born out of the funding market, not from macroeconomic stimulus goals. T-bill purchases were used to replenish reserves, not to buy duration. And "not QE" does not mean "unimportant."
Its re-emergence in 2025 is therefore not a new invention. It is the return of a tool once used after the 2019 repo shock - but in an even more complex context: a larger repo market, a nearly depleted ON RRP, a higher deficit, heavier Treasury issuance, and dealer balance sheets that remain constrained by regulation.
2.2. How does RMP differ from QE?
To avoid arguing over semantics, we should not simply ask: "Is the Fed buying securities QE?" The better question is: what is the Fed buying, for what purpose, through which channel does it impact, and how should the market interpret that signal?
Traditional QE is a macroeconomic stimulus tool. The Fed buys long-term Treasuries and MBS to push down long-end yields, lower mortgage rates, compress the discount rate, and push investors out along the risk curve. When the Fed absorbs duration from the market, investors must reallocate to corporate bonds, equities, real estate, or other risky assets. This is the portfolio rebalancing channel - the core transmission channel of QE.
RMP is different. The Fed primarily buys T-bills and short-term Treasuries. These are not assets with significant duration risk. When the Fed buys T-bills, dealers receive reserves, but the market is not forced to replace a large amount of long duration that the Fed just withdrew from the system. The main impact, therefore, does not lie in the wealth effect or risk-taking, but in reserve replenishment and money market plumbing.
The difference can be summarized as follows:
QE is a macroeconomic easing policy, while RMP is a liquidity maintenance operation.
QE purchases long-term assets, directly impacting the long end of the yield curve, and is usually accompanied by a dovish message: the Fed wants looser financial conditions for an extended period. Therefore, QE does not just impact through the purchase volume. It also works through the expectations channel - the market understands that the Fed is committed to supporting growth, lowering long-term interest rates, and keeping monetary policy accommodative.
RMP does not carry that message. The Fed is not saying: "we want to stimulate the economy." The Fed is saying: "we want to keep reserves in the ample range." This is the language of system operations, not the language of macroeconomic easing.
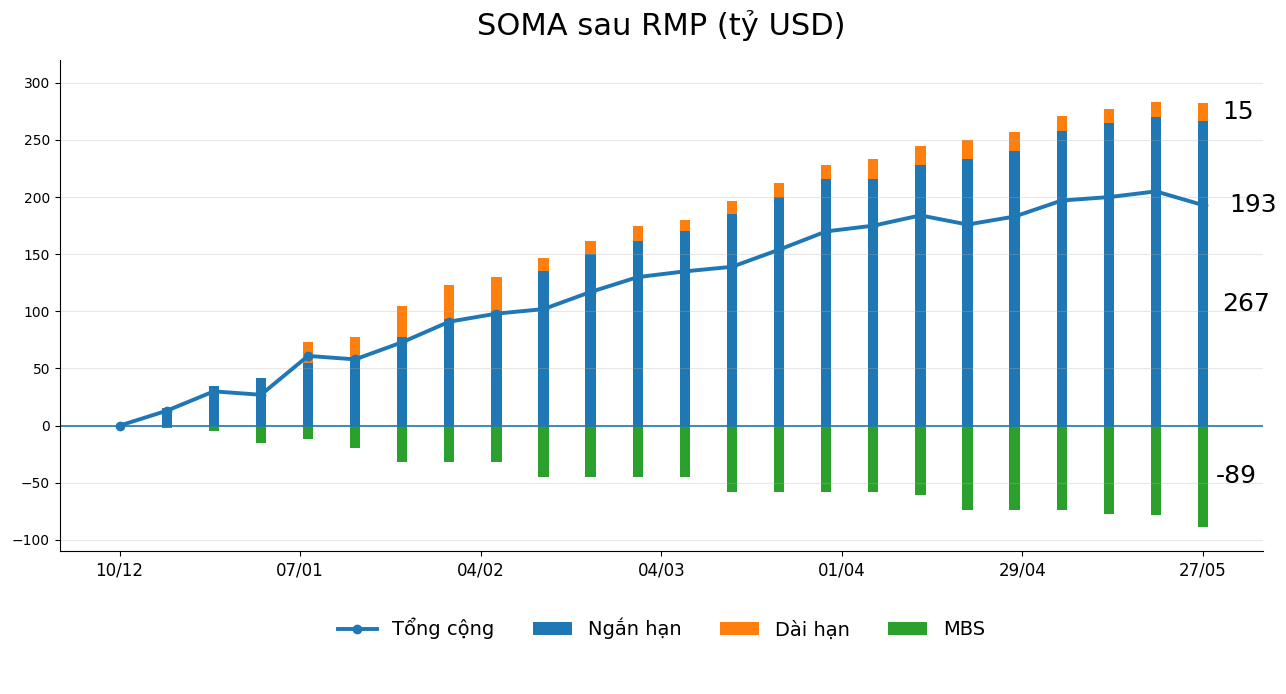
The following chart shows that after RMP began, the increase came primarily from short-term securities. The long-term portion saw a very small increase, while MBS continued to be a negative force due to runoff. The total line is therefore not just a story of "the Fed opening the asset-buying tap," but the net result of two opposing forces: the Fed buying more T-bills on one side, while MBS runoff continues to drag the balance sheet down on the other.
SOMA post-RMP - short-term buying, but still dragged down by MBS runoff
If this were traditional QE, we would expect the Fed to aggressively buy long duration or MBS to directly impact long-end yields and mortgage rates. But in RMP, the composition clearly tilts toward short-term maturities. This reinforces the argument: the primary goal is not to suppress the long-term yield curve, but to replenish reserves to keep the funding market operating smoothly.
In other words, the Fed is not just "injecting." The Fed is injecting to offset. RMP leads to a net increase in SOMA, but that increase must be read alongside MBS runoff and other technical flows. If we only look at the headline "Fed buys securities" and conclude "QE," we miss the underlying structure of the balance sheet.
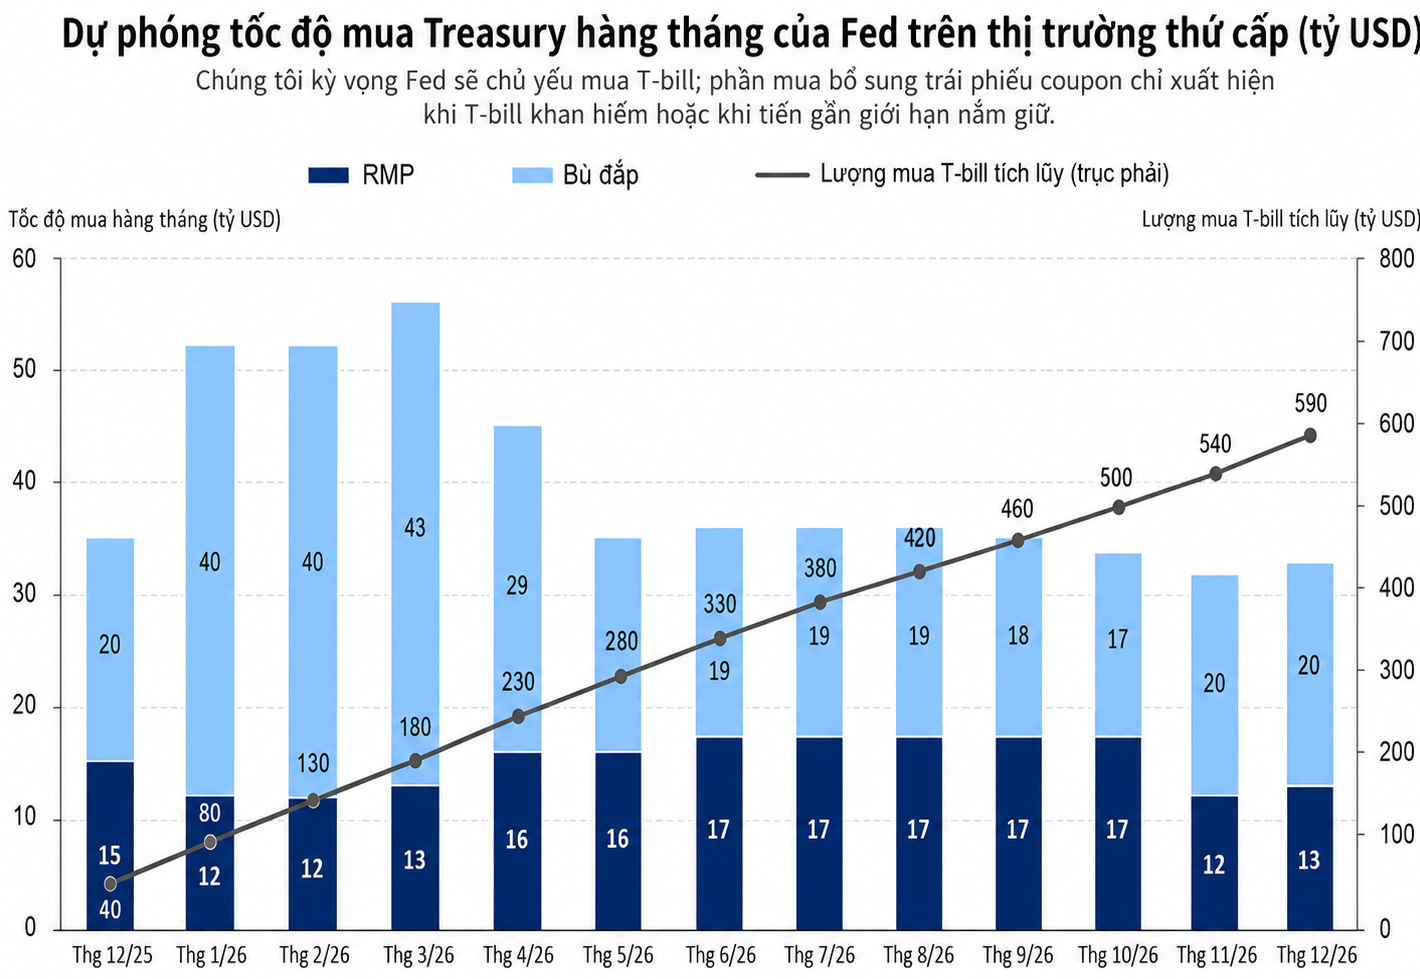
The projected purchase flow also shows that RMP resembles a maintenance program rather than an emergency QE shock.
This chart shows monthly Treasury purchases split between RMP and backfill, while the cumulative line shows total bill purchases increasing over time. The key point is that this is not a massive duration-buying spree like QE during a crisis. This is a relatively steady, short-term purchase flow designed to replenish reserves as other forces - TGA, currency in circulation, MBS runoff - drag reserves down.
Therefore, if QE is the macroeconomic accelerator, RMP is like a pressure maintenance system in the pipeline. It does not try to collapse long-end yields. It tries to keep reserves from sliding out of the ample range.
This does not mean RMP is entirely harmless or has no market impact. The Fed buying T-bills still increases reserves. Repo funding may soften at the margin. Some leveraged strategies could benefit from a more stable funding environment. But those are side effects of the plumbing, not a QE-style policy objective.
Therefore, if a trader looks at RMP and simply concludes: “Fed buying = QE = risk-on forever”, they are overlooking the most important difference.
QE shifts policy expectations. RMP primarily stabilizes funding plumbing.
One is a macroeconomic accelerator. The other is a pressure maintenance system in the pipeline.
2.3. But saying RMP is not QE does not mean RMP is harmless
Distinguishing RMP from QE does not mean denying the side effects of RMP. The Fed buying T-bills still expands the balance sheet. Reserves still rise. Repo funding may soften at the margin. A portion of short-term financial conditions can still be supported.
In other words, RMP is not QE, but it is not an entirely "invisible" operation either.
The first side effect lies in the leverage cycle. When the Fed buys T-bills, financing pressure in the repo market may ease. Repo rates soften, and the cost of leverage for dealers and hedge funds can also decline. This is not the mechanism of traditional QE, as the Fed does not directly absorb long duration from the market or force investors further out along the risk curve. However, cheaper and more stable funding can still create a favorable environment for leveraged strategies.
Therefore, serious criticisms of RMP still deserve to be heard. If banks' repo lending, dealer repo books, margin debt, and hedge fund borrowing all surge while real economic growth fails to keep pace, the issue is no longer about the label "QE or not QE." The issue lies in the possibility that the Fed is unintentionally softening the cost of leverage in a system that is already massive and highly sensitive to funding.
The second side effect is deeper: RMP may contribute to preserving a financial system that has grown too bloated. Since 2008, whenever the plumbing experiences stress, the Fed has typically had to expand or maintain its balance sheet at a higher level. After the 2019 repo stress, the Fed bought T-bills. After COVID, the Fed launched large-scale QE. After the 2022–2025 QT, as reserves approached the efficient floor, the Fed had to halt runoff and activate RMP again.
This creates an uncomfortable feedback loop:
The Fed's backstop makes the repo market more stable.
A more stable repo market can grow even larger.
As the repo market grows larger, it becomes harder for the Fed to let it fall into stress.
The harder it is for the Fed to withdraw, the more the market becomes accustomed to the backstop.
This is the most important structural layer. RMP is not QE by technical mechanism, but it shows that the US financial system is increasingly difficult to operate without a massive Fed balance sheet as a foundation. It is not a macroeconomic accelerator, but it could become a cushion that accustoms the financial market to a new reality: whenever the plumbing gets tight, the Fed will have to step back in to maintain pressure in the dollar pipeline.
2.4. The hidden cost of RMP: The Fed is not insolvent, but that does not mean it is free
An argument that often appears in debates about RMP is: the Fed can create reserves, so creating more reserves is virtually costless. Technically, this argument is partially correct. The Fed is not like a commercial bank. The Fed does not need to "borrow" reserves before creating them. Nor can the Fed become insolvent in the way a private business or a regional bank can.
But concluding from this that RMP is free is a leap too far.
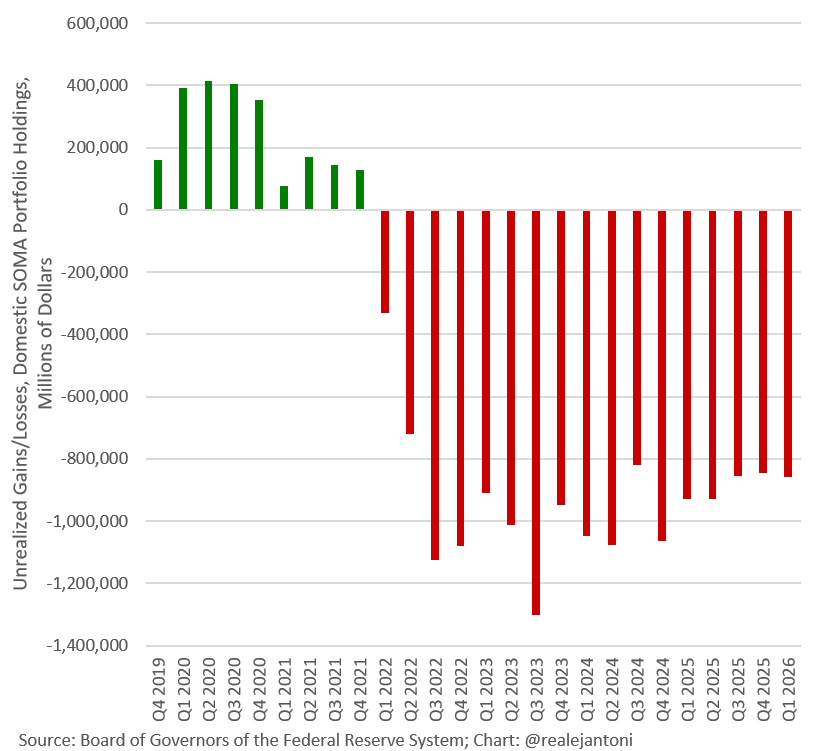
Before 2022, the Fed's SOMA portfolio still recorded positive unrealized gains. But when interest rates rose sharply, the market value of the Treasuries and MBS that the Fed purchased during the low-rate period fell deeply.
From 2022 onward, unrealized gains turned into massive unrealized losses, at times exceeding $1 trillion. Since the Fed is not a forced seller, this loss does not cause the Fed to collapse, but it shows that the Fed's balance sheet is not immune to interest rates.
The cost of RMP lies in three layers:
Interest expense on reserves: When the Fed buys T-bills, reserves increase. As reserves increase, the amount the Fed must pay in IORB to the banking system also rises. If IORB is higher than the average yield of the assets the Fed holds, the Fed can record an accounting loss.
Indirect fiscal cost: When the Fed is profitable, earnings are typically remitted to the Treasury. When the Fed incurs losses, remittances to the Treasury decline or pause. The cost does not disappear; it turns into deferred budget revenue.
Political cost: When reserves are large and IORB is high, a portion of interest income flows from the Fed to the commercial banking system instead of to the Treasury. Technically, this is a normal mechanism of a floor system. But politically, it is easily perceived as the Fed paying interest to banks while the federal budget faces deficit pressures.
Therefore, RMP is not a costless operation. It is like an insurance premium: the Fed accepts the cost of maintaining higher reserves to reduce the risk of a clogged funding market. If the level of reserves drops too low, the cost of a repo stress event could be far greater.
In short: the Fed does not face solvency risk like a commercial bank, but it still incurs accounting costs, opportunity costs, and fiscal costs. RMP is not QE, but it is not "free money" either. It is the price of a larger, more complex financial system that is increasingly dependent on the Fed's balance sheet.
2.5. So how important is this distinction?
Distinguishing between QE and RMP is crucial, because if every Fed asset purchase program is labeled as QE, the market will misinterpret the mechanism.
QE impacts through duration, portfolio rebalancing, and expectations. It pulls down long-end yields, creates a wealth effect, and sends a dovish signal.
RMP operates primarily through reserves and the funding market. It does not necessarily signal the path of the policy rate, nor does it aim to push investors into riskier assets.
But the reverse also warrants caution. Saying RMP is not QE does not mean RMP is entirely neutral. It can still ease repo funding, support marginal leverage, affect dealer balance sheets, and create costs to maintain an ample reserves system.
The most reasonable conclusion is:
Technically, RMP is different from QE.
In terms of market sentiment, RMP can still be interpreted as QE-lite.
Regarding side effects, RMP can ease funding conditions.
Structurally, RMP shows the system's growing dependence on the Fed backstop.
Therefore, RMP is important not because it is 'QE in disguise,' but because it reveals a more uncomfortable reality: the US financial system now needs the Fed to maintain a larger balance sheet just to keep the plumbing from clogging.
PART III - READING THE RIGHT SIGNALS: WHAT THE FUNDING MARKET IS SAYING
After distinguishing RMP from QE, the next step is to read the signals from the right place. To know whether reserves are abundant, ample, or starting to tighten, one should not look first at the 10Y yield. Instead, look at the short-term funding market-where money actually flows through the plumbing every day.
In an ample reserves system, the issue is not whether 'interest rates are high or low' in a general sense. The issue is where overnight rates stand relative to the anchors designed by the Fed. If SOFR, EFFR, or repo rates begin to approach or even exceed the IORB, it is a sign that reserves are no longer as comfortably abundant as before.
Simply put:
The 10Y yield tells the story of growth, inflation, fiscal risk, and term premium.
Funding rates tell the story of plumbing: whether money is flowing smoothly or starting to clog.
To read reserve adequacy, one must look at SOFR, EFFR, IORB, SRF usage, and ON RRP-not just the Treasury yield curve.
3.1. Why is the long-end yield the wrong metric for reserve adequacy?
A common misconception is using the 10Y yield to draw conclusions about the state of reserves. For example: 'The 10Y yield is above 4.6%, meaning interest rates are high, so the system is short of cash.'
This interpretation misses the point. The 10-year yield does not directly measure the abundance or scarcity of reserves in the banking system. It is a much broader macro-financial variable.
The 10Y yield reflects multiple layers of expectations simultaneously: the path of the policy rate, long-term inflation, term premium, fiscal deficit, Treasury issuance, foreign investor demand, and policy uncertainty. Therefore, the 10Y yield can rise even when reserves remain highly abundant. Conversely, the 10Y yield can fall during funding market stress if investors rush into duration for safety.
There are three major forces that can push long-end yields up without directly indicating a shortage of reserves:
Term premium: investors demand a higher risk premium to hold 10-year bonds instead of rolling over overnight cash.
Marginal buyer dynamics: if foreign buyers, pension funds, banks, or asset managers reduce their absorption of long-term USTs, yields can rise even if reserves in the system remain adequate.
Inflation / fiscal risk premium: if the market prices in inflation risks, large deficits, tariff shocks, or supply shocks, long-end yields can rise as investors demand higher compensation.
The clearest example is the 2021–2022 period. The Fed funds rate was still near 0%, the system was flooded with liquidity, and ON RRP swelled to over $2 trillion, yet the 10Y yield still rose sharply. At that time, the funding system was not short of reserves. On the contrary, there was so much excess cash that money market funds had to park it back at the Fed via the ON RRP facility every night.
The key takeaway is: a high long-end yield does not equate to scarce reserves.
The 10Y yield is the thermometer of the long-term macro story. Funding rates are the pressure gauge of the short-term plumbing system.
3.2. The right indicators to read reserve adequacy
To know whether reserves are abundant, ample, or starting to tighten, one must look at the short-term funding market. This is where money is actually borrowed, lent, collateralized, and circulated daily. If the 10Y yield is the macro story, then SOFR, EFFR, repo rates, IORB, and ON RRP are the dashboard of the dollar plumbing.
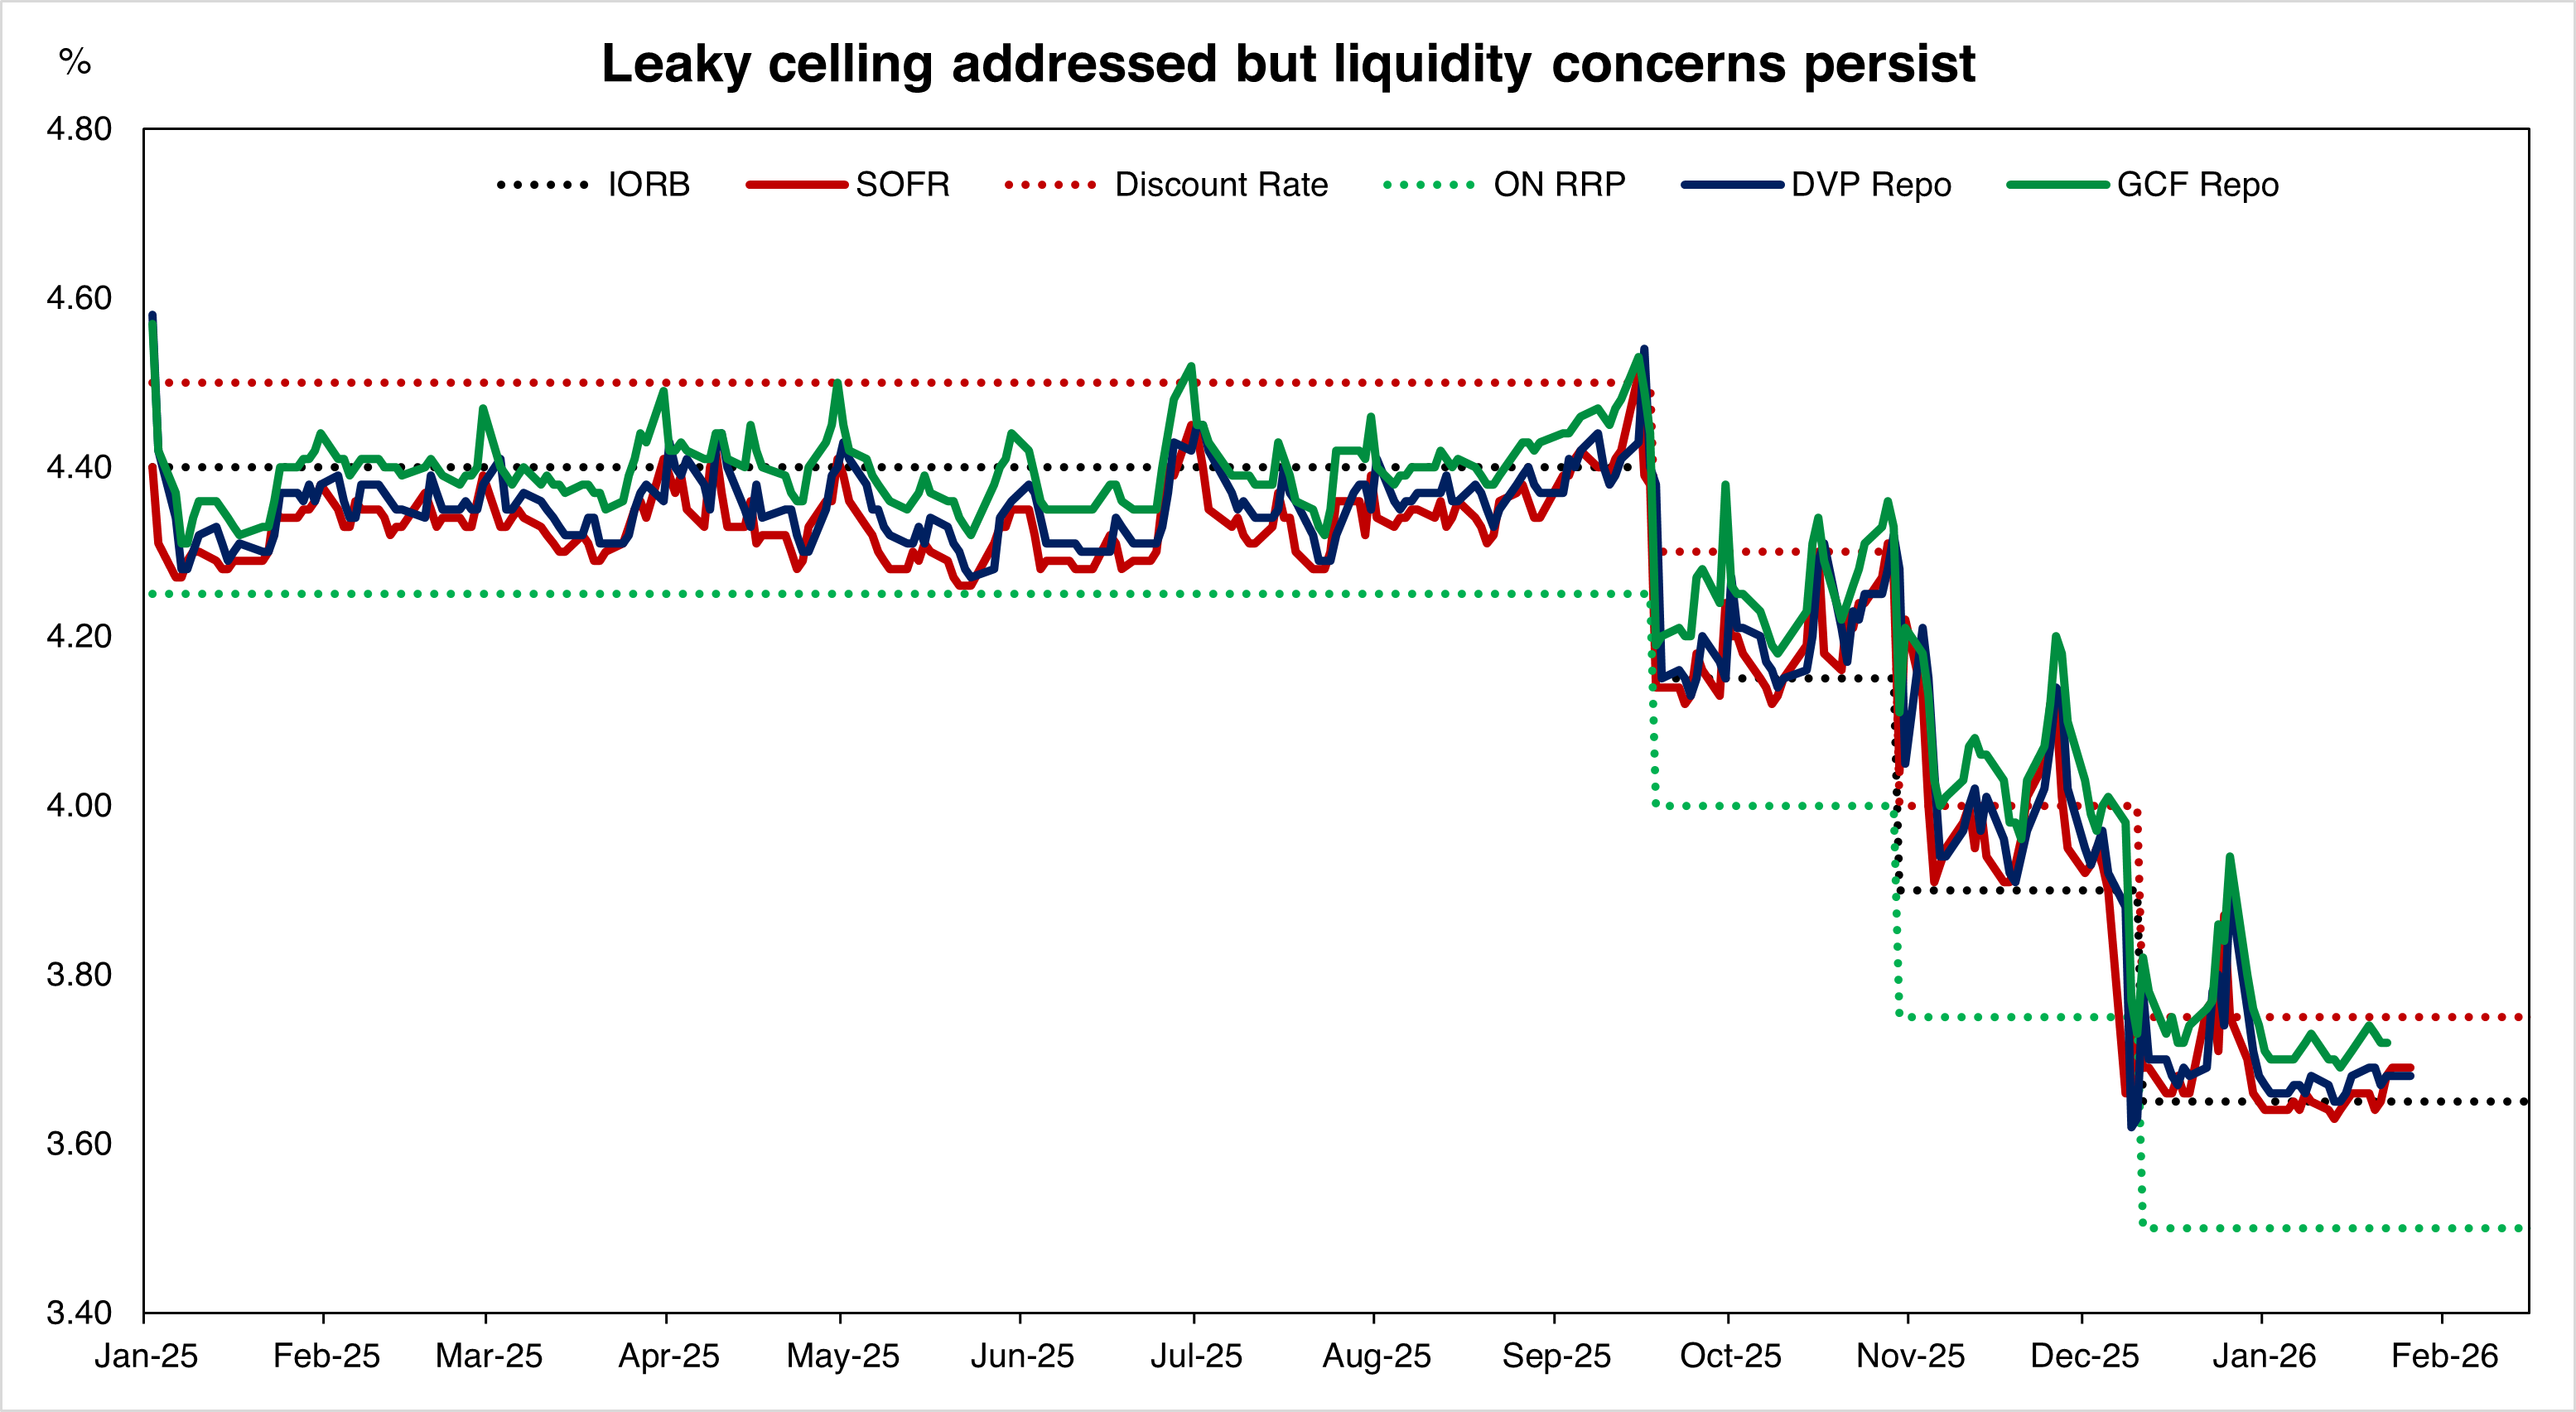
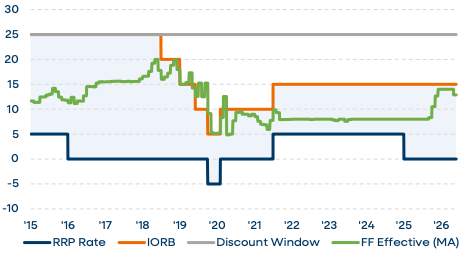
In a floor system, the Fed creates a short-term interest rate corridor. ON RRP acts as the floor for money market funds' cash. IORB is the key anchor for bank reserves. The discount rate stands above as an emergency ceiling. Meanwhile, SOFR, GCF repo, DVP repo, and EFFR are the market rates fluctuating within that corridor.
The following chart shows that although the Fed has partially addressed the 'leaky ceiling' issue, liquidity pressure has not entirely disappeared. Repo rates have repeatedly approached the IORB, occasionally spiking close to the discount rate. This does not mean the system is in crisis, but it shows that reserves are no longer as comfortably abundant as during the abundant phase. The system is still functioning, but the buffer is thinner.
The simple way to read this is:
When SOFR and repo rates are significantly below the IORB, the system has excess cash. This is the abundant state.
When SOFR and repo rates approach the IORB, the system still has adequate reserves, but not much excess. This is the ample zone.
When SOFR or repo rates exceed the IORB, the market is paying a premium to borrow overnight cash. This is a sign that the funding market is starting to tighten at the margin.
When repo rates spike near the discount rate, temporary bottlenecks are emerging in the system, usually related to quarter-end, tax payments, Treasury issuance, or dealer balance sheet constraints.
In addition to SOFR, one should also look at EFFR relative to IORB. During periods of excess reserves, the EFFR typically trades below the IORB because certain institutions like FHLBs do not earn IORB and are willing to lend to banks at lower rates. But when the EFFR approaches the IORB, it indicates that cheap cash in the fed funds market is no longer as plentiful as before.
Another indicator is the FFR–SOFR spread. If the fed funds rate is significantly higher than SOFR, banks are still relatively comfortable deploying liquidity into the repo market. But if SOFR approaches or exceeds the fed funds rate, it shows that cash in the repo market is becoming more valuable.
Finally, there are SRF usage and the ON RRP balance. The SRF acts like the Fed's safety valve for the repo market. If this facility is only used at quarter-end or year-end, it may be seasonal. But if usage rises steadily on normal days, it is a signal that the private market is not distributing liquidity smoothly enough. Conversely, the ON RRP balance shows whether the cash buffer of money market funds is thick or thin. When the ON RRP is low, the system has less buffer to absorb shocks from the TGA, Treasury issuance, or tax payments.
Therefore, individual indicators should not be read in isolation. A repo spike lasting a few days is not enough to conclude that the system lacks reserves. But if multiple signals appear together-SOFR near IORB, frequent repo rate spikes, EFFR approaching IORB, rising SRF usage, and a low ON RRP-the message is clear: the system has not broken, but it has moved far from the abundant state.
3.3. Current signals: 'Slight excess' is shrinking
The funding market is not currently signaling a crisis. But it no longer resembles the 2021–2022 period, when the system was flooded with cash and the ON RRP was still a trillion-dollar liquidity reservoir.
The current message is clearer: reserves remain adequate, but the buffer is thinning.
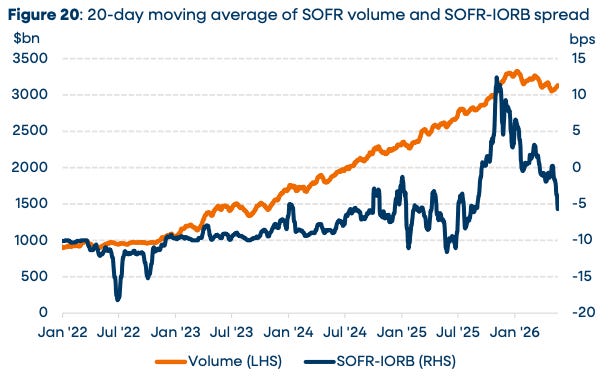
The first signal lies in the repo market. The chart below shows two trends running simultaneously.
SOFR volume rises, SOFR–IORB spread narrows-a larger repo market but a thinner buffer
On one hand, SOFR volume has risen sharply, meaning the repo market is handling a much larger volume of funding than before. Treasury issuance is up, collateral has increased, and financing demand from dealers and levered funds is also greater. The dollar plumbing is not shrinking; it is expanding.
On the other hand, the SOFR–IORB spread is no longer deep below the IORB as it was in the abundant state. When the system has clear excess cash, repo rates are typically dragged below the IORB. But as SOFR moves closer to the IORB, it indicates that cash in the repo market is no longer comfortably abundant. Repo is still functioning, but the price of cash has become more sensitive.
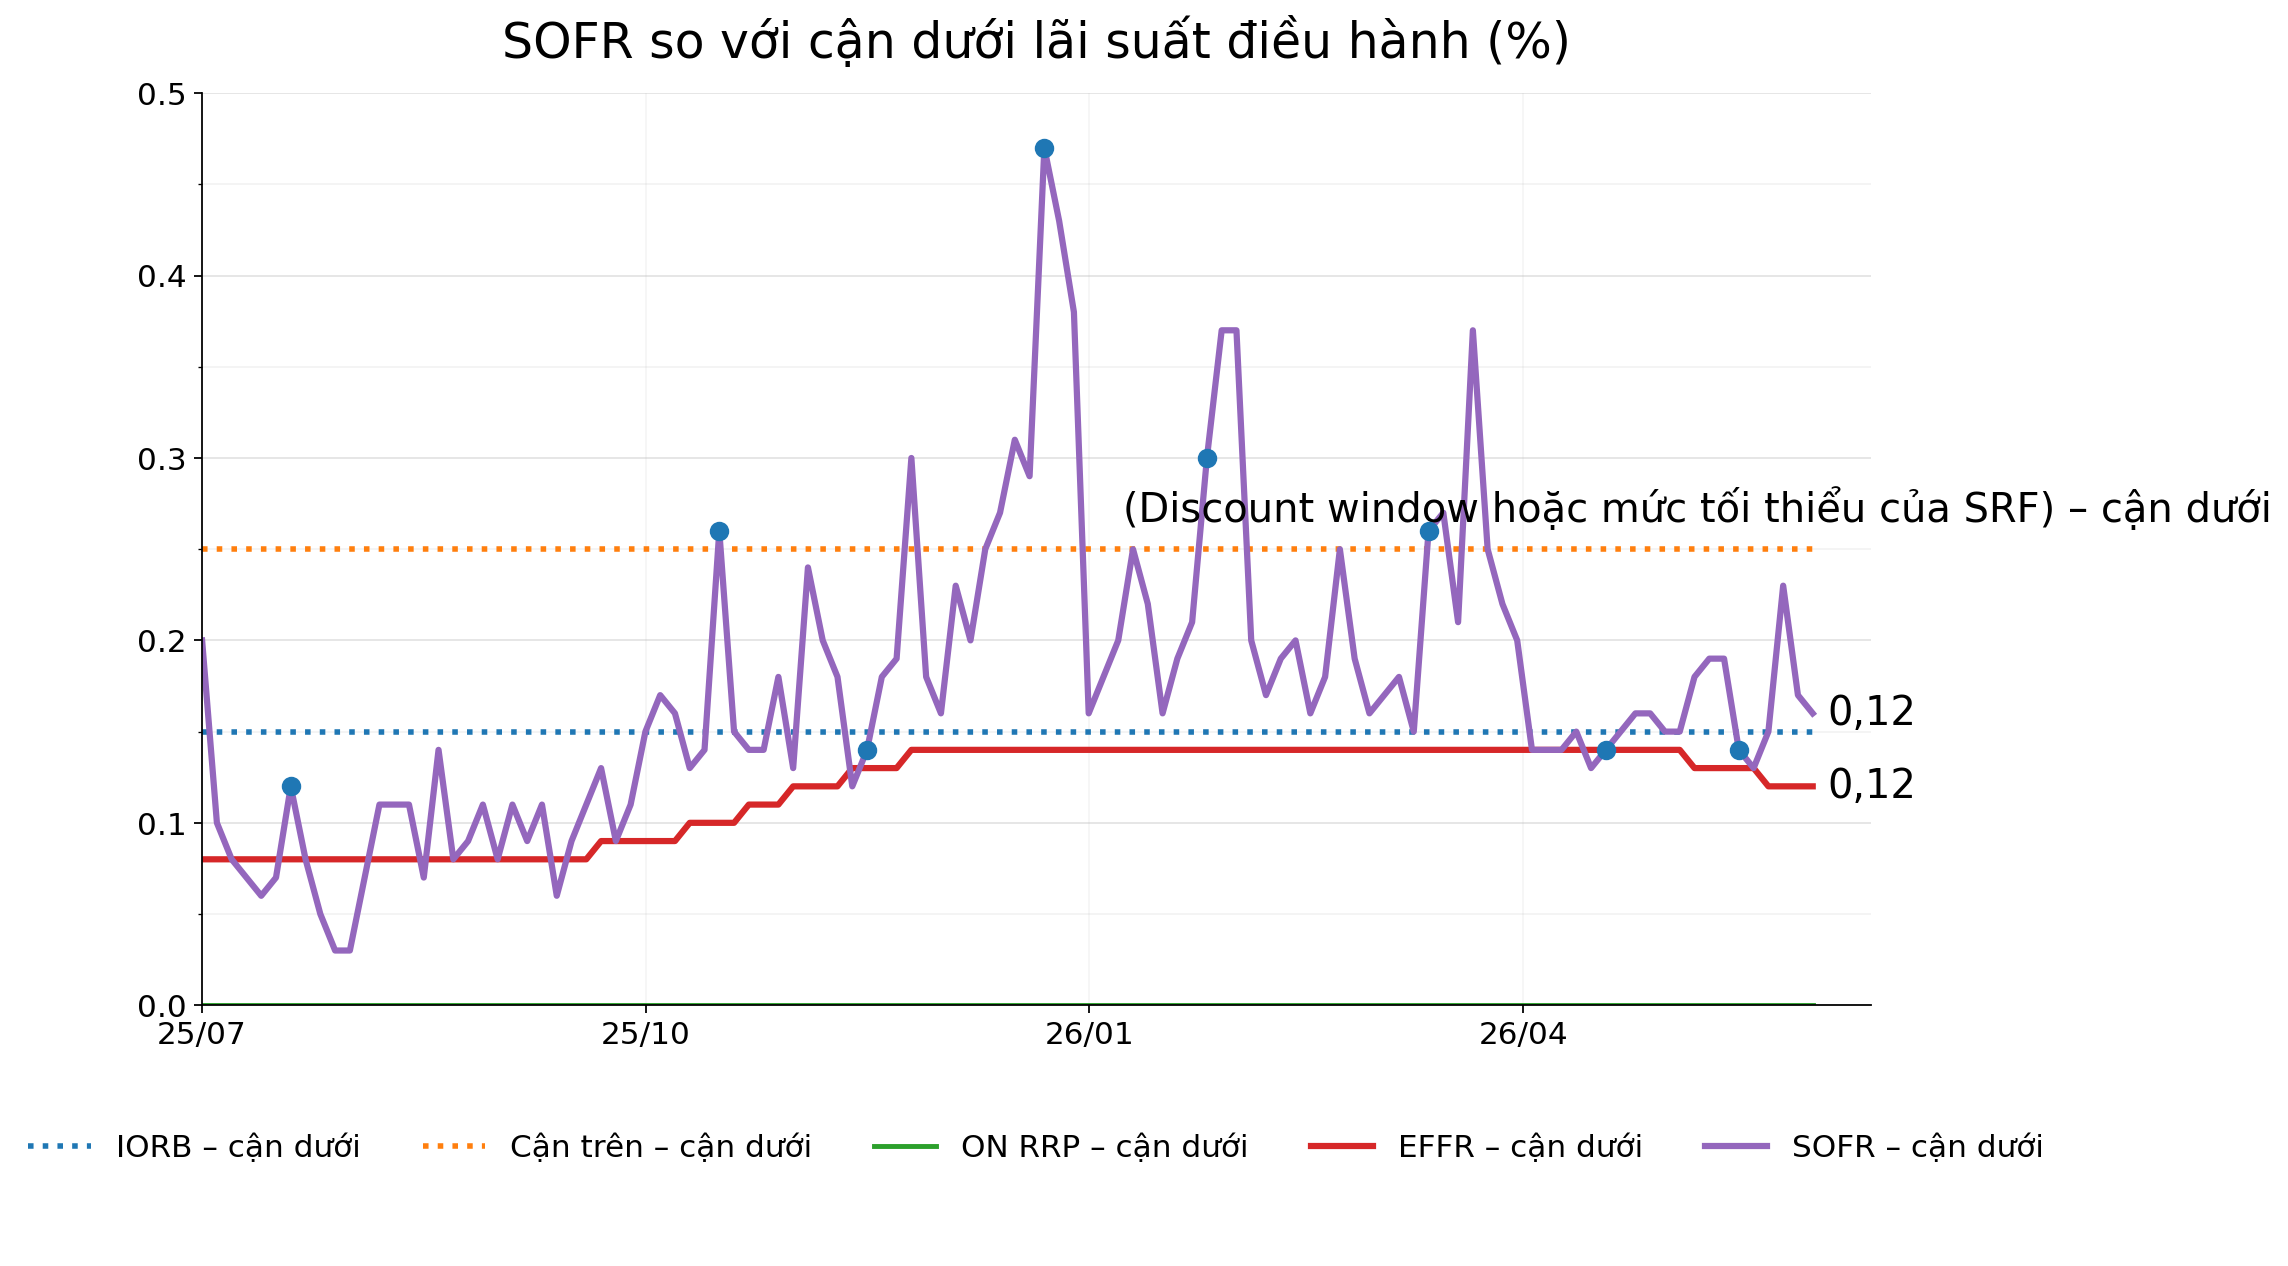
The SOFR chart below compared to the lower bound of the policy range tells the same story.
SOFR vs. the lower bound of the policy rate
SOFR has repeatedly traded above the EFFR and approached the pressure zone. This does not mean the system has entered full-blown stress, but it shows that secured funding is no longer as smooth as before. In an abundant system, overnight rates typically sit comfortably within the corridor. Currently, they operate closer to the Fed's anchors.
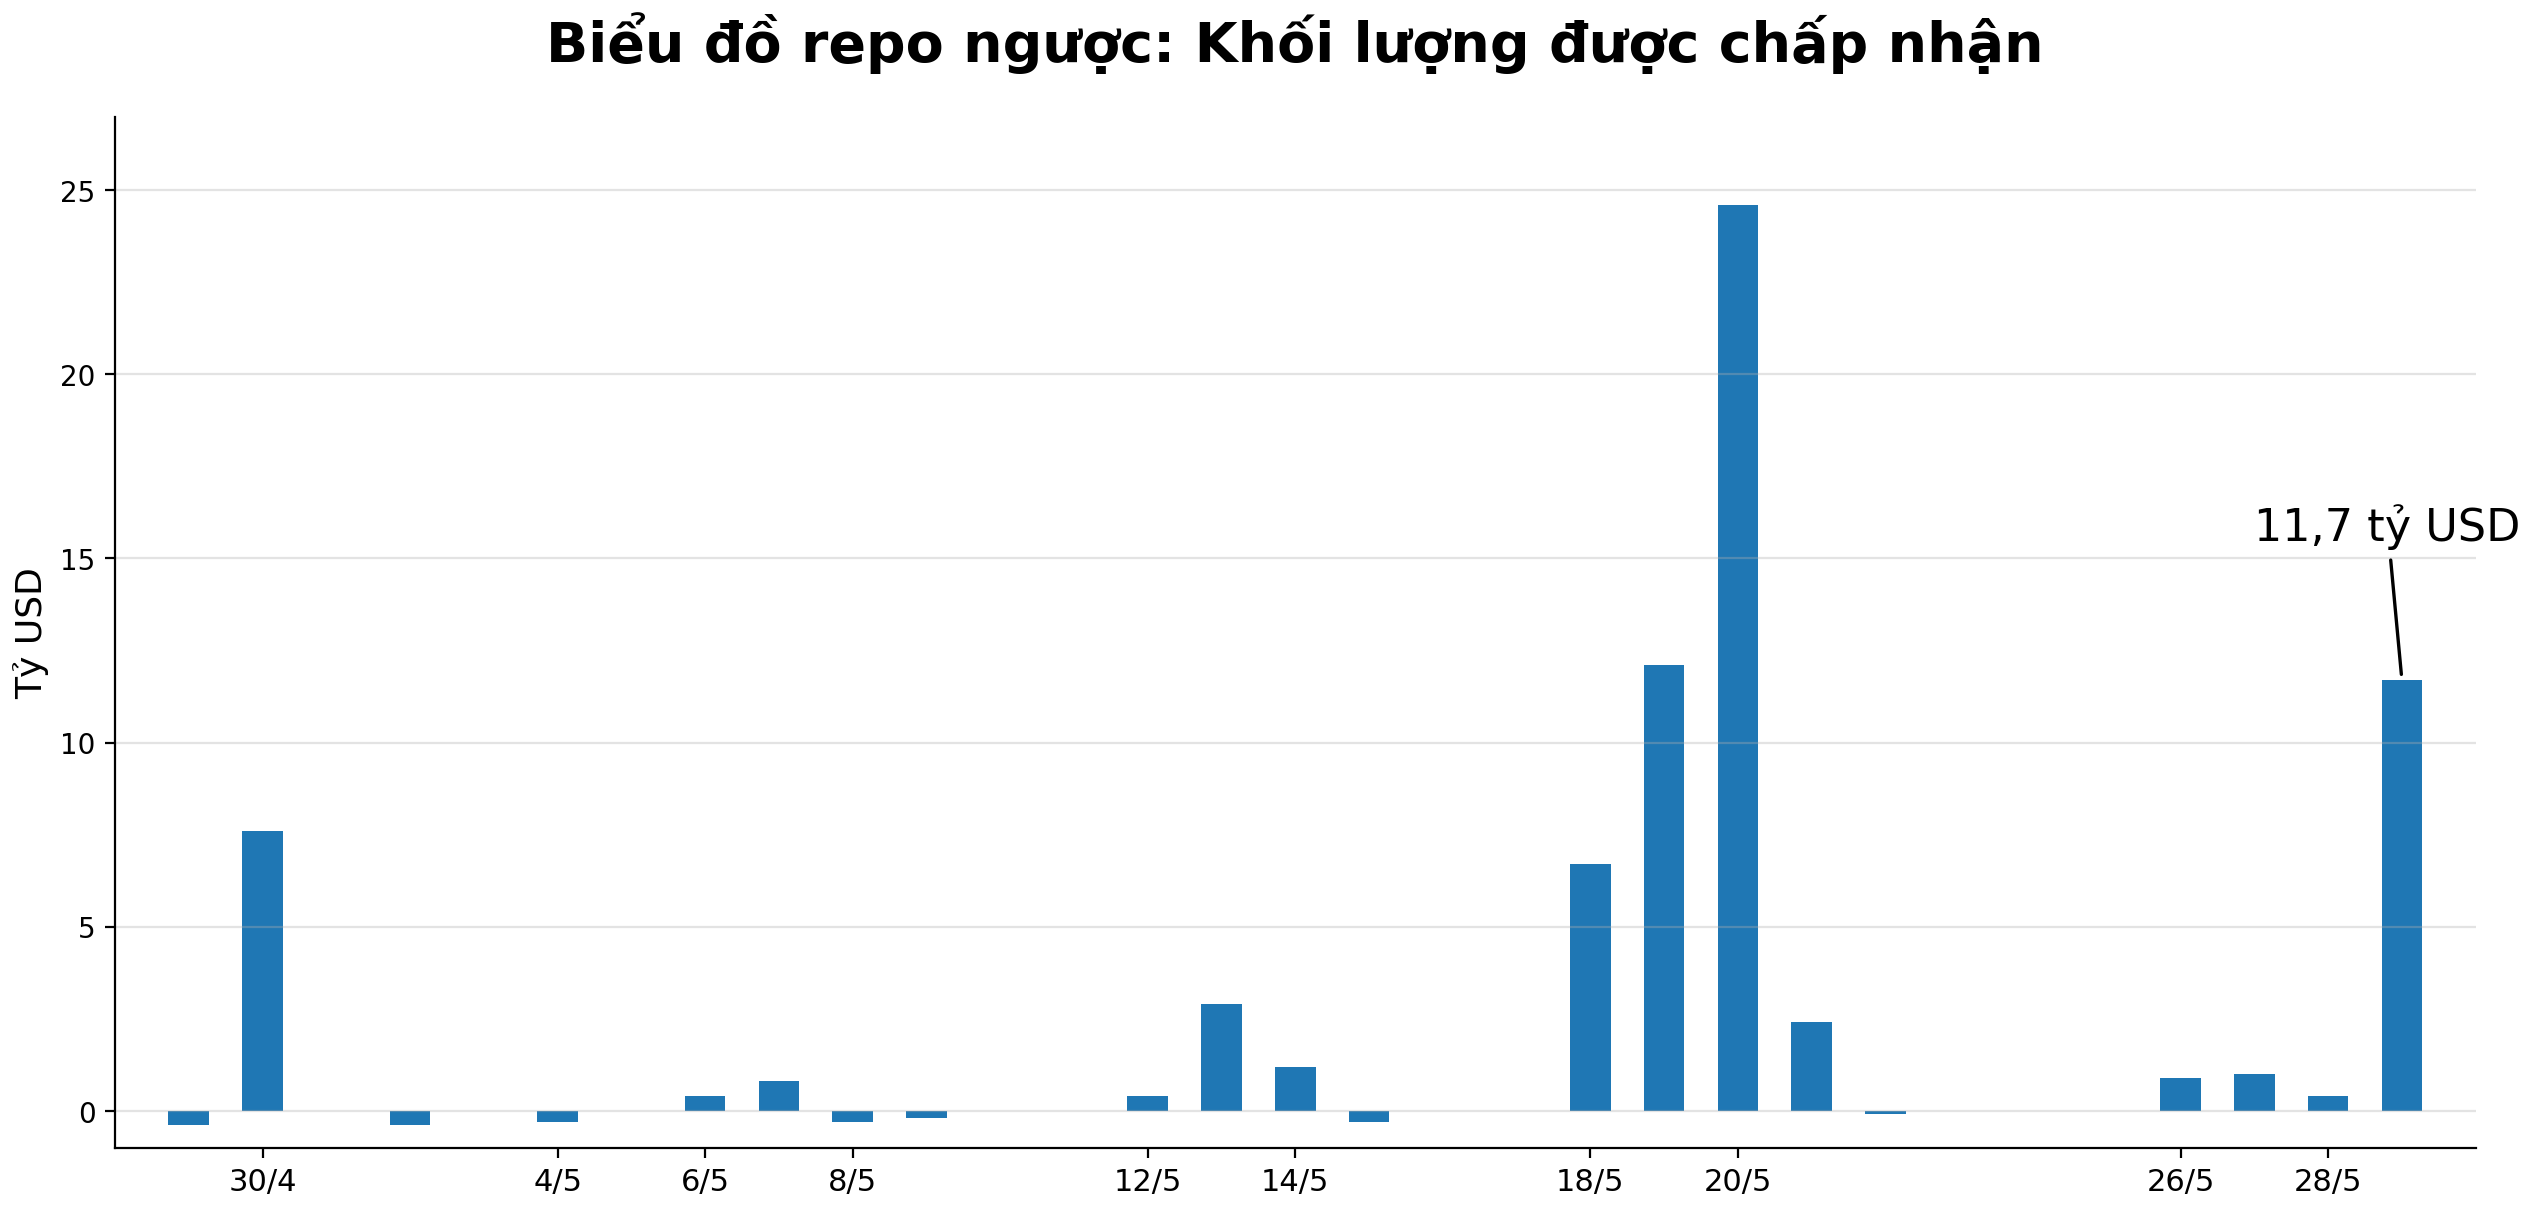
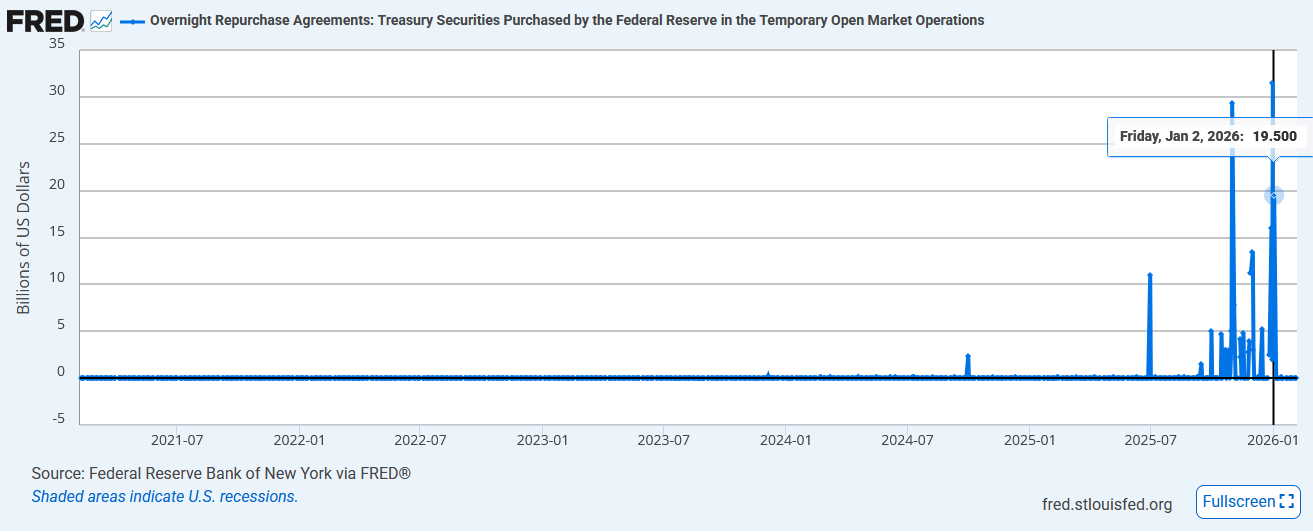
The second signal is repo spikes. The reverse repo accepted volume chart shows that the SRF/repo backstop has been used significantly at times, especially on days when the market needs extra cash. A few spikes are not enough to call a crisis; month-end, quarter-end, or auction settlements always have seasonal factors. But the appearance of these spikes shows that liquidity is no longer so abundant that the private market can smoothly absorb every shock on its own.
Chart: Reverse repo usage-the liquidity buffer is no longer as thick as before
The third signal is that the ON RRP buffer has thinned significantly. During the 2021–2023 period, money market funds could park trillions of dollars back at the Fed overnight. That was a massive buffer for the system. When the TGA rose, Treasury issuance was large, or tax payments drained cash, the ON RRP could act as a reservoir to absorb the shock. But with the ON RRP now much smaller, any liquidity drain is likely to transmit faster into the repo and fed funds markets.
Therefore, the current state is not 'scarce' like September 2019, but it is no longer 'abundant' like when the ON RRP held trillions of dollars.
Less excess cash: The SOFR–IORB spread narrows, showing that repo cash is no longer extremely cheap.
More frequent spikes: secured funding is more sensitive to the TGA, auction settlements, tax dates, and quarter-end.
A lower buffer: The ON RRP is no longer the massive reservoir it once was.
This is the most uncomfortable state for the Fed: not tight enough to be called a crisis, but thin enough that it cannot be ignored.
Simply put, there is still water in the pipes. But the water level is no longer as high as before, while the pipes are handling a larger volume. That is why RMP was introduced: not to launch a new round of QE, but to prevent the funding market from slipping from 'ample' to 'scarce'.
3.4. Why is the 'slight excess' state more dangerous than it looks?
"Slightly excess" sounds safe. But in the funding market, the issue is not the average. The issue is the marginal shock.
An abundant system can absorb multiple liquidity drains without sharp volatility. A scarce system is clearly dangerous. But the middle ground - ample but with a thin buffer - is the truly misleading zone. From a distance, everything looks fine. Reserves remain high. Interest rates do not spike. The repo market still functions. But all it takes is a major drain from the TGA, a larger-than-expected Treasury auction, or quarter-end balance sheet constraints, and funding rates could react non-linearly.
This is where the market often underestimates. Plumbing does not break gradually or linearly. It usually functions fine until a bottleneck appears, and then stress spreads rapidly. The 2019 repo crisis is a prime example: beforehand, no one thought reserves of over $1 trillion were "scarce." But within just a few days, the market clearing rate proved otherwise.
In the current context, the biggest risk is not an immediate crisis. The greater risk is that the Fed misjudges the thickness of the buffer.
If the Fed buys too little, reserves could slide into scarce territory as the TGA or issuance rises.
If the Fed buys too much, the market could misinterpret the RMP as QE-lite and increase leverage.
If the Fed communicates unclearly, both sides of the market could misunderstand the policy objective.
Therefore, the RMP is a fine-tuning exercise that is harder than it looks. The Fed must inject enough to keep the plumbing from clogging, but not so much that the market believes a new round of easing has begun.
3.5. Conclusion: What is the funding market saying?
The message from the funding market today is not "a crisis has arrived." But neither is it "liquidity remains infinitely abundant."
The more accurate message is: the system is in the zone of ample but not abundant. In layman's terms: there is still enough water to keep the pipes running, but the water level is no longer as high as before. If there are a few more major drains, pressure could drop quickly.
This is precisely why the RMP exists. The Fed does not look at the 10Y yield to decide whether reserves are adequate or scarce. The Fed looks at short-term signals in the funding market: SOFR, EFFR, IORB, SRF usage, ON RRP, and the spreads between them. These indicators show that the system has not broken, but there is little room for complacency.
The conclusion of Part III can be wrapped up in a single sentence:
Do not use the 10Y yield to measure reserve adequacy. Look at the funding market. The long-end yield tells the macro story. SOFR, EFFR, and the SRF tell the plumbing story.
PART IV - WHY THE FED'S BALANCE SHEET CANNOT RETURN TO "PRE-2008" LEVELS
A question that often arises in debates about the Fed is: if QE was an emergency measure, why can't the Fed's balance sheet shrink back to pre-2008 levels?
The short answer: because the post-2008 US financial system is no longer the same as the pre-2008 system. Not only is the Fed larger, but the liquidity needs of the entire system are also greater.
Before 2008, the Fed could operate with very small reserves. Following the financial crisis, three structural changes have made that virtually impossible to replicate.
4.1. Three structural changes that give the Fed's balance sheet a higher "floor"
The first change is a much larger TGA.
Before 2009, the Treasury kept a portion of its cash at commercial banks. After the crisis, the Treasury's cash was consolidated more into the Treasury General Account - TGA at the Fed.
This is important because whenever the TGA increases, reserves in the banking system decrease.
Treasury collects taxes or issues debt → money flows into the TGA → reserves decrease.
Treasury spends → money flows out of the TGA → reserves increase again.
The larger and more volatile the TGA, the larger the reserve buffer the Fed needs to prevent sudden liquidity shortages in the system.
Simply put, the TGA is like a large reservoir on the Fed's balance sheet. When this reservoir draws in water, the level of reserves in the banking system drops.
The second change is banks need more reserves due to regulation.
After 2008, banks no longer operated with thin liquidity buffers. Regulations such as Basel III, the Liquidity Coverage Ratio (LCR), stress tests, and new supervisory requirements have made bank reserves at the Fed an extremely critical asset. For large banks, reserves are not just "idle cash at the Fed." They are the most liquid, safest, and easiest-to-use asset class when the market enters stress.
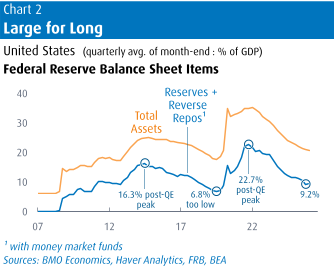
The following chart shows why the question "Can the Fed return to its pre-2008 balance sheet?" is misleading. As a percentage of GDP, bank reserves and reverse repos post-financial crisis have become a much larger part of the US monetary system.
Reserves are larger because the system needs more liquidity
This is not just a legacy of QE. It also reflects a new demand for liquidity: banks are required to hold more High-Quality Liquid Assets (HQLA), the repo market is larger, and the entire system needs more cash-like assets to run smoothly.
The notable point is 2019. When reserves and reverse repos fell to around 6.8% of GDP, the repo market began to experience stress. This shows that the issue is not that the Fed wants to maintain a large balance sheet out of policy preference. The issue is that the post-2008 system requires a higher minimum level of reserves to avoid clogging.
Therefore, if we use the area around 9% of GDP as a technical benchmark for "ample reserves," reserves alone would need to be close to several trillion dollars in the current economy. When adding the TGA, currency in circulation, and other liabilities, it is very difficult for the Fed's balance sheet to return to its pre-2008 size.
In short: The Fed can be smaller than during the crisis-era QE, but it is unlikely to be as small as pre-2008, because the system no longer operates with the same liquidity demands as before.
The third change is the global role of the US dollar.
The US does not just operate a monetary system for itself. It operates the liquidity core of the global dollar system. When foreign central banks, official institutions, and global investors need safe USD assets, demand for Treasuries, reserves, repo collateral, and dollar liquidity all increase.
Therefore, the Fed's balance sheet cannot be as small as before when three things coexist:
The Treasury holds more cash at the Fed via the TGA.
Banks need more reserves due to regulation.
The world needs more dollar safe assets and dollar liquidity.
The technical conclusion is: even if the Fed does not engage in new QE, its balance sheet is unlikely to return to pre-2008 levels. The minimum size of the plumbing system has grown. The Fed can shrink its balance sheet, but it cannot pretend that the dollar system of 2026 is still the dollar system of 2007.
4.2. Fiscal dominance: When the Fed's balance sheet is no longer entirely a choice
There is a deeper reason why it is difficult for the Fed to shrink its balance sheet too aggressively: the massive US budget deficit.
When the US government runs high deficits, the Treasury must issue more debt. But debt issuance is not just a fiscal story. It is also a plumbing story: who buys those Treasuries, which balance sheets are used to absorb them, how they are financed via repo, and whether the system has enough reserves for settlement.
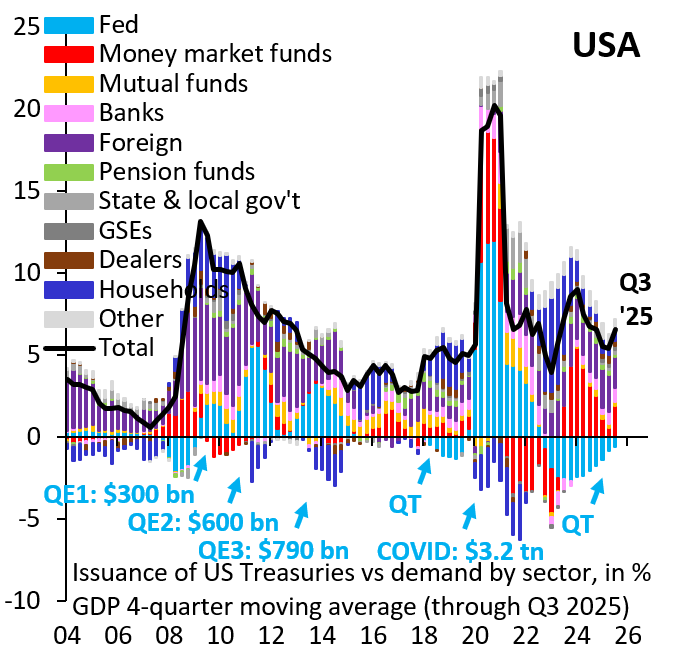
The following chart shows that the volume of Treasuries issued to the market does not just disappear. It must be absorbed by a specific group of buyers: the Fed, money market funds, mutual funds, banks, foreign investors, pension funds, dealers, households, GSEs, and other institutions. During QE periods, the Fed directly absorbed a large portion of the supply. But as the Fed withdraws via QT, the private market must shoulder more.
Who is absorbing Treasuries? As the buyer base changes, it becomes harder for the Fed to withdraw from the plumbing
This makes the system more sensitive to three points:
Money market funds do they have enough cash to buy bills?
Dealers do they have enough balance sheet capacity to hold Treasury inventory?
The repo market does it have enough capacity to finance leveraged investors?
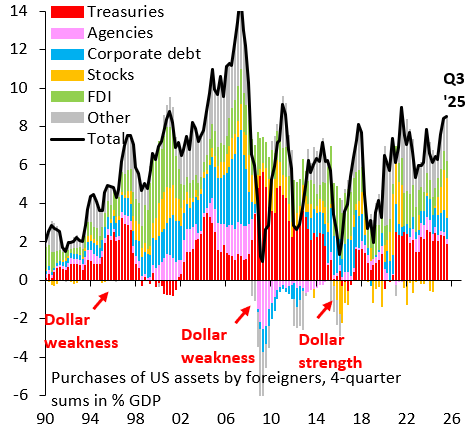
The next chart adds an important layer: foreign buyers are not always a stable marginal buyer. Foreigners still buy many US assets, but buying flows change with the dollar cycle, yields, geopolitical risks, and reserve rebalancing needs. There are periods when foreign buyers aggressively purchase Treasuries; there are other periods when they shift to equities, corporate debt, FDI, or reduce purchases of USD assets.
Foreign capital flows into US assets - foreign buyers are not always a stable marginal buyer
When Treasury issuance is large and foreign demand is not stable enough, the remainder must be absorbed by domestic buyers: money market funds, households, banks, dealers, and repo-funded investors. Consequently, the system requires more balance sheet capacity, more repo financing, and more reserves for settlement.
This is a more subtle form of fiscal dominance than the image of "the Treasury forcing the Fed to print money." The Treasury does not need to order the Fed to buy bonds. The massive deficit alone creates an operational gravity:
Large deficit → Treasury must issue more debt.
Large issuance → buyer base must absorb more Treasuries.
Unstable foreign demand → domestic funding system must shoulder more.
Dealers and hedge funds need more repo financing.
Expanding repo market → demand for reserves for settlement and intermediation increases.
Reserves too thin → short-end rates are prone to spiking.
The Fed remains independent on paper. But in operational reality, the Fed cannot allow the short-end funding market to spin out of control simply because reserves are drained too deeply while Treasury issuance surges. This is a plumbing constraint, not just a policy choice.
Therefore, the RMP is not just a reaction to a few weeks of funding stress. It is a manifestation of a larger structure: when deficits are high, Treasury issuance is large, the buyer base must shoulder more, and foreign demand is no longer an absolutely stable buffer, it becomes increasingly difficult for the Fed to withdraw from its role as the ultimate pressure valve for the dollar system.
4.3. Conclusion: The Fed can be smaller, but is unlikely to return to the pre-2008 era
The key point is not that the Fed cannot shrink its balance sheet. The Fed can still do that.
The Fed can:
Reduce MBS over time.
Shift its portfolio toward short-term Treasuries.
Reduce the pace of the RMP if the funding market stabilizes.
Set a clearer framework for the long-term balance sheet size.
But the Fed is unlikely to return to a pre-2008 balance sheet if three major conditions persist: high deficits, regulations requiring large reserves, and a continuously expanding repo market.
Therefore, the right question is not: "Should the Fed return to pre-2008 levels?"
The better question is: what changes are needed in fiscal policy, banking regulation, and repo market architecture so that the Fed can be smaller without the system clogging?
Without answering that question, demanding that the Fed return to a pre-2008 balance sheet is merely a nice slogan. In terms of plumbing, the dollar system has grown much larger, more complex, and far more dependent on the Fed than ever before.
PART V - THE WARSH ERA: PHILOSOPHY MEETS PHYSICS
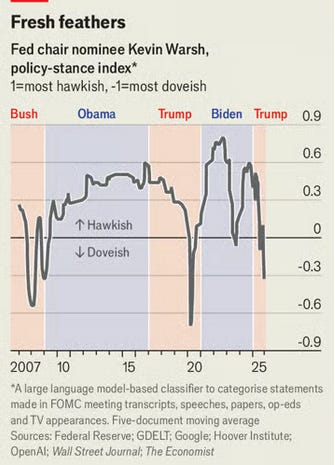
Kevin Warsh enters the Fed with a very clear philosophy: the Fed's balance sheet has grown too large, lasted too long, and made the market too dependent on the central bank.
But the big question is: how far can a new Fed Chair change the system, when that system has been built over nearly two decades of QE, ample reserves, and repo backstops?
The answer is not a simple "yes" or "no." Warsh can change the direction. But he cannot immediately alter the physical forces governing the system: massive fiscal deficits, post-2008 regulations, a colossal repo market, and the FOMC as a collective mechanism.
In short: Warsh has a philosophy. But the system has gravity.
5.1. What does Warsh want?
Warsh is not a typical hawk who simply wants higher interest rates. What sets him apart is his consistent view that the Fed has done too much for too long, inadvertently making financial markets dependent on the central bank.
Since the days of QE2 under Bernanke, Warsh has worried that the Fed was entering dangerous territory: instead of merely stabilizing the currency, it began acting as a permanent backstop for financial assets-and the lender of last resort for a political system unable to address its fiscal issues.
Simply put, Warsh wants a Fed that is "back to boring": less prominent, less market-guiding, less reliant on its balance sheet as a policy tool, and only stepping to the forefront when the system is in crisis.
But that is no easy task, as the modern Fed is no longer a central bank that simply sets a policy rate and stands aside.
The modern Fed does not just set a single interest rate-it operates an entire corridor
This chart shows why Warsh's philosophy of a "smaller, less interventionist Fed" faces a system far more complex than the pre-2008 era. Today's Fed operates through an entire interest rate corridor: ON RRP at the floor, IORB anchoring bank reserves, the discount window at the ceiling, and effective rates where the market actually trades.
Therefore, if Warsh wants the Fed to be less "front-and-center," he cannot just change his tone. He must deal with a system accustomed to being regulated by corridors, facilities, reserves, repo backstops, and a massive balance sheet. The Fed may want to return to its role as a "silent gatekeeper," but post-2008 money markets have been designed to operate around a highly visible Fed.
In short, Warsh's agenda has four key pillars:
An orderly shrinking of the Fed's balance sheet, rather than letting a bloated balance sheet become the permanent new normal.
Setting clearer targets and timelines, so the market does not always assume the Fed will step in whenever volatility spikes.
Gradually phasing out MBS, to reduce the Fed's role in distorting the housing market.
Shifting the Fed's portfolio closer to short-term Treasuries, making it simpler and less involved in credit allocation.
Crucially, Warsh is not just talking about balance sheet mechanics. He is talking about the Fed's role in the economy.
To him, an oversized Fed does not just pose macroeconomic risks. It also creates distributional risks: those holding financial assets benefit more from liquidity and asset-price support, while those without assets are left behind. The more the Fed intervenes, the more the market learns to wait for a bailout. And once the market is accustomed to being rescued, bringing the Fed back to a "boring" state becomes far more difficult.
Thus, Warsh wants a smaller, simpler, and less interventionist Fed.
But here lies the paradox: to make the Fed "boring" again, Warsh must first manage a system that is anything but boring.
5.2. Why Warsh cannot pivot the system too quickly
Warsh can change the Fed's rhetoric, framework, and expectations. He can clarify the terminal balance sheet, phase down the role of MBS, and try to steer the Fed back to a leaner balance sheet.
But he cannot change the mechanics of the system with a single speech.
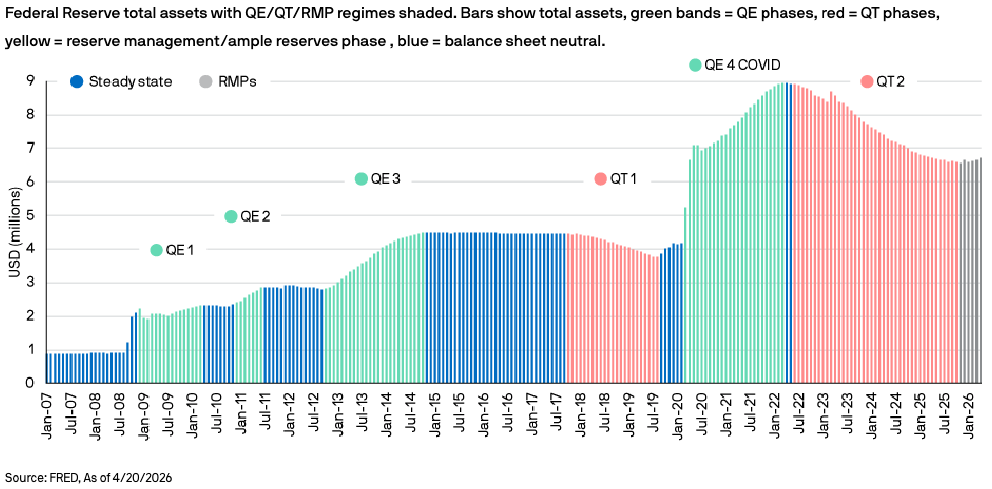
Since 2008, the Fed's balance sheet has no longer been a secondary tool behind the policy rate. It has become an integral part of the US liquidity architecture. QE phases expanded the balance sheet; QT phases tried to shrink it; and RMP sits in the middle-not traditional QE, but still the Fed's way of keeping reserves in ample territory.
The Fed's balance sheet across QE, QT, and RMP regimes
The green areas represent QE phases-when the Fed expanded its balance sheet to stabilize the system or stimulate the economy. The red areas show QT phases-when the Fed tried to shrink its balance sheet. The yellow/RMP areas show a more intermediate state: the Fed is no longer conducting QE in the traditional sense, but still must purchase short-term assets to keep reserves in ample territory.
The lessons of history are clear: every time the Fed shrinks its balance sheet too deeply, the plumbing pushes back. The 2017–2019 QT ended in repo market stress. The 2022–2025 QT also had to slow down as reserves approached sensitive levels. Thus, while Warsh may want to reduce the Fed's footprint, he cannot simply slash the balance sheet rapidly without testing the funding market's resilience.
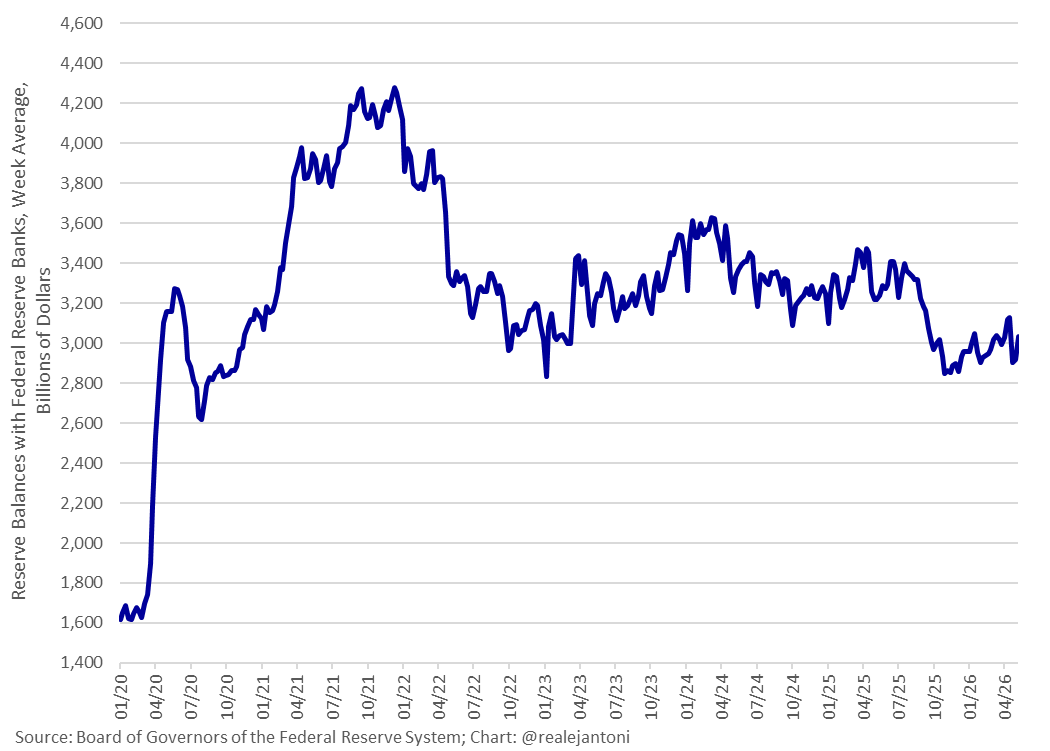
The first constraint is that reserve levels remain very high, but are no longer as abundant as before.
The following chart shows that bank reserves remain around $3 trillion-far higher than pre-pandemic levels. However, this absolute figure is misleading. Today's system is larger, the repo market is bigger, Treasury issuance is heavier, and the ON RRP is no longer the thick buffer it was during 2021–2023. Thus, while "$3 trillion" sounds substantial, it may not represent comfortable abundance.
Warsh wants a smaller Fed, but reserve levels remain very high
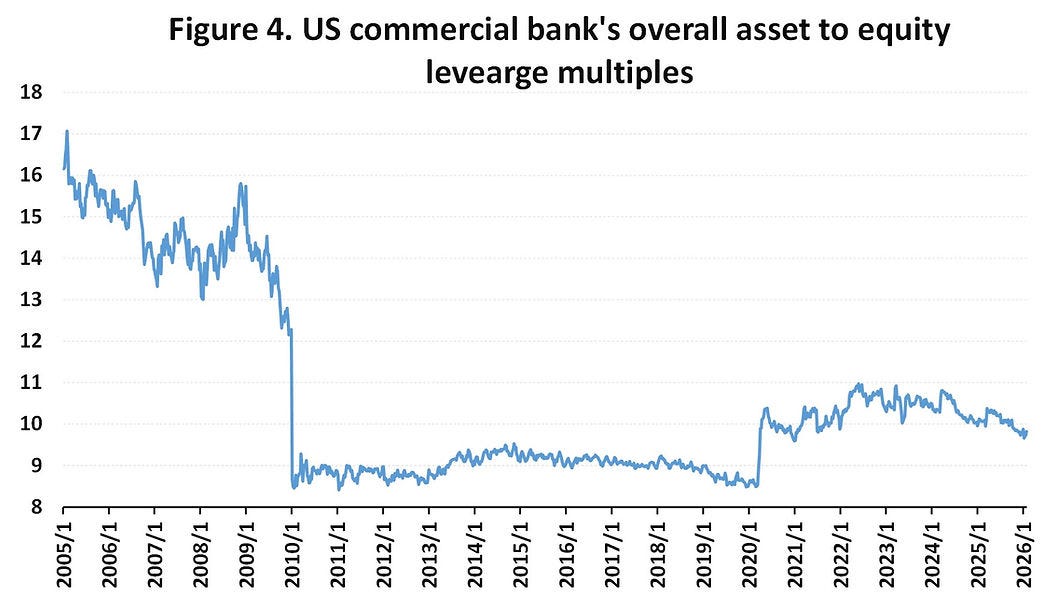
The second constraint is that banks no longer want to return to pre-2008 leverage levels.
The asset-to-equity leverage chart shows that US commercial bank leverage fell sharply after the financial crisis and has never returned to its previous levels. This is not just a regulatory story. It also reflects risk appetite, shareholder pressure, capital requirements, and new banking business models. Even if Warsh supports deregulation or SLR reform, it will not automatically prompt banks to expand their balance sheets enough to replace the Fed.
US commercial banks asset-to-equity leverage - banks are unlikely to return to pre-2008 leverage
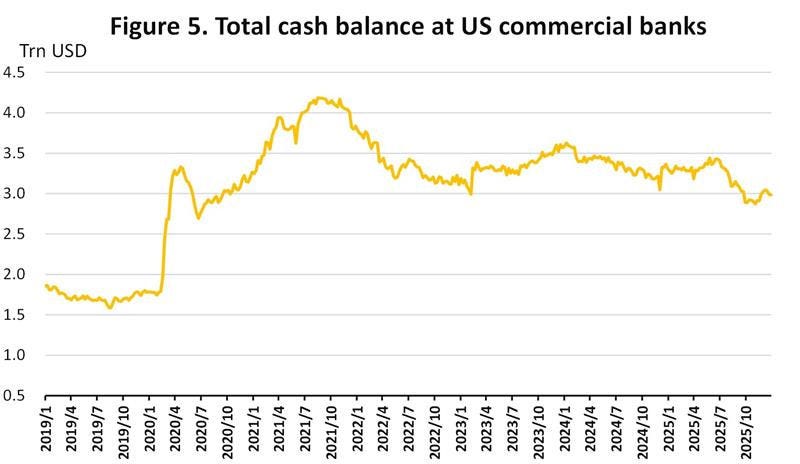
The third constraint is that bank cash balances are the fuel for intermediation.
The following chart shows bank cash surging alongside QE, then gradually declining as QT drains reserves from the system. If the Fed shrinks its balance sheet too quickly, bank cash buffers will drop. When buffers decline, banks typically do not expand their balance sheets; instead, they become more cautious. This could weaken repo intermediation, Treasury absorption, and credit creation.
Total cash balance at US commercial banks - cash/reserves are the true fuel for leverage
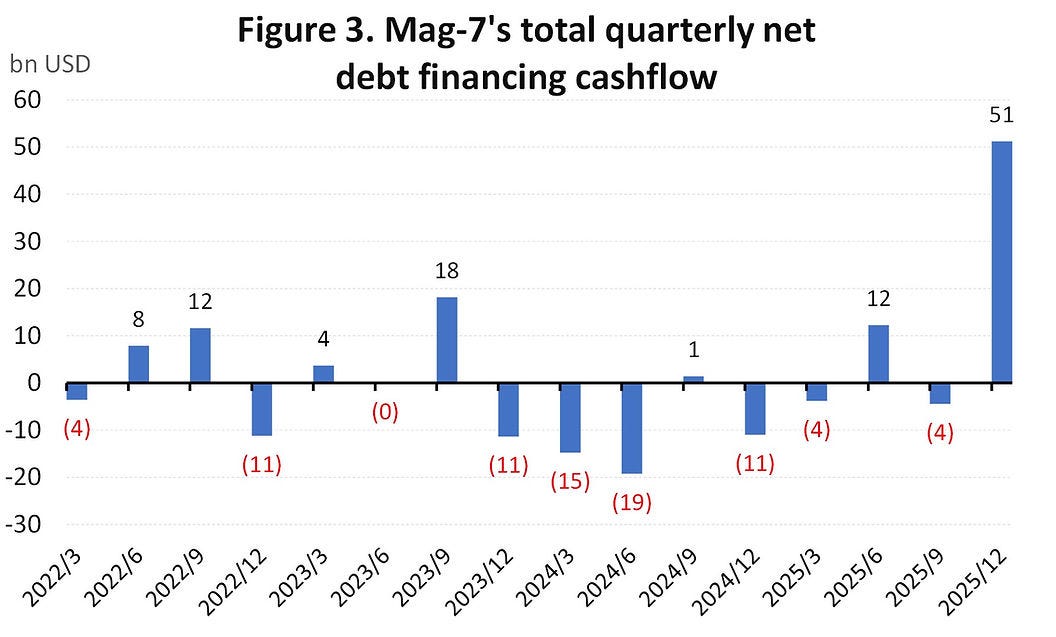
The fourth constraint is that credit demand outside the banking system is rising.
The Mag-7 net debt financing chart below shows that Big Tech is starting to require more funding as AI capex surges. Data centers, chips, cloud infrastructure, and power infrastructure all demand massive capital. At the same time, the Treasury needs to issue more debt. If the Fed shrinks its balance sheet while letting the funding market tighten, the debt market will have to absorb too much capital demand simultaneously.
Mag-7 net debt financing cashflow - AI capex is starting to require more funding
This is why "rate cuts + QT" sounds appealing on paper but is difficult to execute in practice. The Fed can cut the policy rate, but if QT drains reserves, tightens repo funding, shrinks bank balance sheets, and widens credit spreads, actual financial conditions may not ease.
In short: the policy rate may go down, but funding pressure could still go up.
Therefore, Warsh's challenge is not whether he wants a smaller Fed. The real question is whether the system can withstand a smaller Fed.
If reserves remain the fuel for money market plumbing, if banks refuse to return to pre-2008 leverage, if both the Treasury and AI capex require greater funding, and if the FOMC wants to avoid a repeat of the 2019 repo stress, Warsh will have to move slower than his "smaller Fed" slogan suggests.
He can change the Fed's tone. He can set a target for a leaner balance sheet. But he cannot defy the system's gravity.
Warsh may hold the steering wheel. But the road, the payload, and the vehicle's engine are not of his choosing.
5.3. Three realistic scenarios
Given the constraints above, the question is not whether Warsh wants a smaller Fed. The more practical question is: how fast can he shrink the Fed without triggering a backlash in the funding market.
There are three notable scenarios.
Scenario 1 - Gradual reduction with a framework
Probability: 55%
This is the most likely scenario. Warsh does not abruptly halt RMP, but instead announces a clearer framework for the terminal balance sheet: the Fed wants a smaller balance sheet, fewer MBS, and less intervention, but the shrinking process will depend on funding indicators.
In this scenario, the Fed reduces RMP in small steps. Each step is conditional: SOFR must not frequently exceed IORB, the EFFR must remain stable within the corridor, SRF usage must not spike abnormally, and the ON RRP must not drain to the point where the market loses its buffer.
Regulatory reform could also help. If the SLR or certain balance sheet constraints are moderately relaxed, dealers and banks could absorb more Treasury inventory and repo exposure. This would allow the Fed to reduce its footprint without causing an immediate shock.
This is the "philosophy meets reality" scenario: Warsh maintains his smaller Fed agenda, but implements it at a pace the system can handle.
Scenario 2 - Pause and reassess
Probability: 30%
In this scenario, Warsh pauses or reduces RMP once reserves appear adequate. Initially, the market reacts calmly because aggregate reserves remain high. However, during periods of seasonal tightening-tax payments, Treasury settlements, quarter-end, or year-end-the funding market begins to tighten.
This is not a crisis. But it forces the Fed to slow down, pause its RMP reduction plan, or adjust its framework. Operationally, this is a routine reassessment. But narratively, it is somewhat unfavorable: the market might interpret it as Warsh wanting to shrink the balance sheet, only to be dragged back by the plumbing.
Notably, this scenario is highly realistic because the system is no longer in an abundant regime. The ON RRP is no longer a trillion-dollar buffer. Treasury issuance remains massive. Dealer balance sheets are still constrained. Thus, with poor timing, funding pressure could return even if aggregate reserves still look large.
Scenario 3 - Shrinking too fast and being defeated by reality
Probability: 15%
This is a lower-probability but highest-risk scenario. Warsh cuts RMP too quickly to signal a sound money stance and a smaller Fed. Reserves drain faster than the system can absorb. A TGA spike, a large auction, tax dates, quarter-end, or a drop in demand from foreign buyers causes the repo market to tighten sharply.
Consequently, SOFR could exceed the IORB more frequently, repo rates could spike, SRF usage could surge, and the Fed would be forced to intervene. The tools could include the SRF, repo operations, or restarting RMP on a larger scale.
This is the worst-case scenario for credibility. The Fed would not only have to pivot, but do so defensively. The market would read it as the Fed trying to shrink its balance sheet based on philosophy, only for the plumbing to reject it.
The lesson of 2019 lies right here: shrinking the balance sheet too deeply does not make the Fed more "disciplined" if the end result is having to expand it even faster during a funding stress event.
5.4. Underestimated risk: stress is not confined to US repo
An easily overlooked point in the Warsh narrative is that stress from the Fed's balance sheet does not necessarily stop at the US repo market. The dollar is the global funding currency. When the Fed drains liquidity, pressure can spill over into the offshore dollar market-particularly through FX swaps and cross-currency basis.
Therefore, if Warsh wants to reduce or end RMP, he needs a sufficiently credible alternative mechanism. On paper, the SRF, Discount Window, or repo operations can serve as backstops. But in reality, these facilities are not the same as RMP.
The chart below illustrates this clearly. Repo operations are rarely a permanent flow. They typically lie dormant, then spike sharply when the funding market begins to tighten. In other words, RMP is like preventive maintenance: the Fed buys T-bills in advance to keep reserves in ample territory. Repo operations are like a relief valve: only truly deployed once pressure has already built up.
Repo operations are not a permanent flow - they are a relief valve when funding tightens
This is the risk for Warsh. If RMP is withdrawn too early while Treasury issuance remains heavy, the TGA fluctuates, the ON RRP is no longer a thick buffer, and the repo market is expanding, the system will have to rely more on backstops that still carry friction: stigma, collateral rules, eligibility, and operational frictions. The SRF and Discount Window exist on paper, but they may not replace an active purchasing flow like RMP in maintaining market sentiment.
In short: if you abandon preventive maintenance, you must prove the relief valve actually works.
The greater risk is that stress could manifest first in the offshore dollar market.
The following chart shows that during liquidity crunches, the relationship between US interbank liquidity and offshore dollar funding can break down or invert. When the TGA rebuilds, QT expands, or Treasury issuance surges, USD pressure can appear first in FX swaps and cross-currency basis, even if aggregate reserves in the US system still appear ample.
The dollar pipeline does not stop in New York - it runs all the way to Asian FX swaps
This is crucial because the dollar pipeline does not stop in New York. Asian banks, corporates, sovereigns, and global investors all rely on USD funding through FX swaps, repo, and hedging markets. When dollar funding tightens, the basis widens, hedging costs rise, and volatility in regional money markets can escalate.
Thus, RMP is not just a New York repo desk issue. It is part of the global dollar system. If RMP is reduced too quickly, and the SRF or Discount Window is not yet credible enough to replace it, stress could propagate in a highly disruptive sequence: offshore basis tightens first, repo spreads react next, and then the Fed is forced to intervene again.
The conclusion is that Warsh cannot just ask whether RMP can be reduced. He must prove that the system has sufficient facility reform, enough dealer capacity, and enough dollar liquidity to reduce RMP without straining the offshore dollar plumbing. Without that foundation, he will have to move slowly-not for lack of resolve, but because the dollar pipeline runs far beyond US borders.
5.5 What can Warsh actually change?
Warsh is constrained by the system's plumbing, but that does not mean he is powerless. While he is unlikely to shrink the balance sheet rapidly without causing stress in the funding market, he can still alter the Fed's trajectory in a slower, more orderly, and more sustainable manner.
The first thing Warsh can change is the expectations framework. If he establishes a clearer roadmap for the terminal balance sheet-how small the Fed wants it to be, its composition, and the conditions that allow for RMP reductions-the market will have to reprice the Fed put. Once the market believes the Fed will no longer intervene for every minor bout of volatility, risk-taking may become less dependent on the assumption that "the Fed always has our back."
The second point is the composition of the balance sheet, especially MBS. This is perhaps the easiest part of Warsh's agenda to justify. The Fed holding MBS means its balance sheet is biased toward a specific sector: housing. Gradually reducing MBS and shifting to short-term Treasuries or a more neutral structure could make the Fed less distortive to the credit market, without necessarily causing immediate funding stress like a sharp withdrawal of reserves.
The third point is regulatory reform. If banks and dealers can better intermediate Treasuries and repos, the system will be less dependent on the Fed's backstop. SLR reform, adjusting the treatment of reserves and Treasuries, or changes that make intermediary balance sheets more flexible could create more capacity for the private market. This is the crucial "foundation-building" part: improve the plumbing first, then shrink the balance sheet more aggressively later.
The fourth point is clearer rules for using QE/RMP. One of the issues of the post-2008 era is that the market does not know exactly when the Fed will return to asset purchases. Warsh might try to draw a clearer distinction: QE is only for macro crises or severe market dysfunction; RMP is only used to maintain reserves in the ample zone; while normal volatility does not automatically trigger the Fed put. If this can be achieved, the Fed could regain some credibility without causing an immediate shock.
Therefore, Warsh's actual change does not lie in an aggressive balance sheet reduction. It lies in the sequencing:
Change expectations first.
Make the balance sheet more neutral.
Improve plumbing and regulation.
Only shrink more aggressively when funding indicators permit.
The conclusion is: Warsh can turn the ship, but he cannot make the ocean disappear. His philosophy could pull the Fed toward being smaller, less interventionist, and more disciplined. But the speed of travel will be determined by the physics of the system: SOFR, EFFR, SRF usage, the FFR–SOFR spread, ON RRP, and the private market's capacity to absorb Treasuries.
If plumbing indicators are stable, Warsh has the room to execute his agenda. If they tighten, the "smaller Fed" philosophy will have to slow down. In the world of funding markets, speeches can change expectations, but overnight rates are what determine how fast the Fed can go.
PART VI - THE BIGGER PICTURE: QUESTIONS RMP DOES NOT ANSWER
At this point, a relatively clear conclusion can be drawn: RMP is not QE in the traditional sense. It does not buy long duration, does not aim to pull the 10Y yield down, does not send a "low for long" signal, and does not directly trigger portfolio rebalancing like QE.
But saying RMP is not QE does not mean all questions are resolved. In fact, RMP only answers a very narrow question: how to keep reserves in the ample zone so the funding market does not clog?
The bigger questions remain.
Is the Fed unintentionally helping the Treasury issue debt more easily? Is RMP keeping leverage costs in the repo market lower than their natural level? Is a large Fed balance sheet creating a form of implicit subsidy for the banking system? And what should investors watch to know if the system is truly stable or just being kept stable by a backstop?
That is the part RMP cannot answer. And it is also the most important part if one wants to look beyond the question of "Is RMP QE?".
6.1. Is the Fed helping the Treasury "too much"?
This is the most uncomfortable question in the entire debate over RMP.
Officially, the Fed does not buy T-bills to finance the Treasury. The Fed buys them to maintain reserves in the ample zone, keep the funding market from clogging, and protect its control over short-term interest rates.
But in market reality, these two things are not entirely separate.
When the Fed buys T-bills, it becomes an absorber of a portion of the bill supply. This helps the market digest issuance more easily than if the entire new debt load had to be absorbed by money market funds, primary dealers, hedge funds, and banks.
In other words, the Fed is not necessarily "monetizing the deficit" in the classical sense. But it is making the deficit financing process run more smoothly at the plumbing level.
Net debt issuance FY 2025–2026 - issuance pressure has not disappeared
This chart shows that issuance pressure is not a minor variable. FY2025 has seen net debt issuance on a massive scale, while FY2026 continues upward if the projected trajectory holds. This is not just a budget story. It is a plumbing story: every additional Treasury debt issuance requires buyers, dealer balance sheets, repo financing, and ultimately reserves for settlement.
But to understand the pressure on reserves, one cannot just look at gross issuance. What matters more is net new cash - the new cash the Treasury actually drains from the market after subtracting maturing debt.
Net new cash - the portion the Treasury actually drains from the market
This table shows why the concept of net new cash is important. If the Treasury issues $241 billion in bills but has $230.8 billion in maturing bills, the net cash drain is only about $10.2 billion. But if it issues $199 billion in coupons while only $130.9 billion matures, the Treasury drains an additional $68.1 billion in cash from the market.
This is the part that directly increases the TGA and pulls reserves out of the banking system.
Therefore, the question is not just: who buys Treasuries?
The deeper question is: does the system have enough balance sheet capacity and reserves to absorb that net cash drain without straining the funding market?
This is where RMP becomes sensitive. If the Fed buys T-bills right when the Treasury needs to issue a lot of debt, RMP could unintentionally do three things at once:
Reduce the pressure on the private sector to absorb bills.
Reduce the demand for repo financing if the Fed partially replaces the role of levered buyers.
Soften repo rates, thereby reducing the cost of leverage for dealers, hedge funds, and basis traders.
This is a point Adam Josephson criticizes quite sharply. If the Fed says it must expand its balance sheet because "demand for Fed liabilities" is rising, but that demand is rising partly because large Treasury issuance causes the repo market and financial sector balance sheets to swell, then the argument begins to look circular.
Simply put: the Fed says the system needs more reserves. But the system needs more reserves partly because the government has to issue more debt, the repo market is larger, and financial institutions must expand their balance sheets to handle that debt.
This is the real tension:
If the Fed does not buy, the funding market could tighten.
If the Fed buys, Treasury issuance becomes easier to digest.
If issuance is easier to digest, the pressure for fiscal reform may weaken.
If the fiscal deficit remains large, the system will again need a larger Fed balance sheet.
Therefore, RMP should not be simply described as "the Fed printing money for the Treasury." The story is more subtle: the Fed is protecting the system's plumbing, but that very protection may help the system withstand higher fiscal stress for a longer period.
That is the gray area of RMP.
It is not QE in the traditional sense. But it is also not entirely neutral to Treasury financing. When the deficit is large, issuance is large, the repo market is large, and reserves become a prerequisite for the system to smoothly absorb debt, the line between "liquidity maintenance" and "softening fiscal pressure" becomes blurred.
RMP therefore does not solve the root problem: the US is issuing too much debt relative to the market's natural capacity to absorb it without an ever-larger Fed backstop.
In short: The Fed does not directly finance the Treasury. But the Fed is helping the system finance the Treasury with less pain.
6.2. Fed losses: not bankrupt, but not free
Another often overlooked question is the cost of the ample reserves system. Since the Fed can create reserves, many say expanding the balance sheet is "costless." In terms of solvency, this is true: the Fed does not go bankrupt like a commercial bank.
But economically, it is not free.
The Fed pays IORB on the banking system's reserves. When IORB is high, the Fed must pay a large amount of interest to banks. Meanwhile, many assets on the Fed's balance sheet were purchased during a period of very low interest rates, with much lower coupons. As a result, the Fed can incur accounting losses.
This loss does not appear like a typical corporate loss. The Fed records it as Earnings Remittances Due to U.S. Treasury - a deferred liability. Simply put: instead of transferring profits to the Treasury as before, the Fed will have to retain future earnings to cover losses before resuming remittances.
The key point is: taxpayers do not see a direct bill. But the Treasury loses a future revenue stream from the Fed. Thus, the cost still exists, it just takes an accounting detour.
Three things must be distinguished:
The Fed has no insolvency risk like a commercial bank.
But the Fed still incurs interest costs when paying IORB on reserves.
When the Fed incurs losses, the Treasury loses future remittances, meaning the cost is indirectly shifted to the fiscal side.
This does not mean RMP is wrong. But it means RMP should not be called free. A larger reserves system helps stabilize the funding market, but in return comes higher interest costs, lower Fed profits remitted to the Treasury, and a bigger political question: why is the banking system paid large interest on reserves while the Fed is losing money?
RMP does not answer this question. It only says that reserves must be maintained. Who bears the cost of that maintenance - the market, the Treasury, banks, or taxpayers - is a different story.
CONCLUSION: THE FED CAN BE SMALLER, BUT IT CANNOT RETURN TO THE OLD DAYS
RMP is a sign of a structurally changed system, not evidence of a new policy.
The Fed did not activate RMP to stimulate the economy. The Fed activated RMP because three drains on reserves are constantly at work - Treasury issuance, currency growth, and MBS runoff - and without a counterbalance, the system would naturally drift out of the ample zone. This is not "printing new money." It is running to stand still on a downward escalator.
The more important question remains open: why does the current US financial system need the Fed to constantly maintain reserve levels just to keep the dollar plumbing from clogging? The answer does not come from monetary philosophy. It comes from structure: a larger TGA, regulations requiring reserves as HQLA, a $12 trillion repo market, a fiscal deficit of 5.8% of GDP, and a Fed balance sheet that has become the technical backbone of global liquidity rather than just a domestic policy tool.
Warsh understands this. He is not naive. But he steps in with a clear philosophy that the system needs to be pulled back - however slowly, however difficult, and despite the counter-forces. That deserves respect. The question is not whether he is right or wrong in the long run. The question is whether the speed and sequencing match what the plumbing allows.
Personal Prediction: Fed Balance Sheet by End-2027
Prediction: $6.2–6.6 trillion by December 2027.
Here is how I arrived at this figure:
Current foundation: The Fed's balance sheet is currently at ~$6.7 trillion, with SOMA holdings (Treasuries + MBS) accounting for the majority. RMP is currently at $25 billion/month, plus MBS reinvestment of ~$15–20 billion/month, bringing total T-bill purchases to around $40–45 billion/month - enough to keep the balance sheet nearly flat after subtracting MBS runoff.
The Warsh slow trimming scenario: If Warsh gradually reduces RMP according to the pace I analyzed in Part V - $25 billion → $15 billion → $10 billion/month quarter-by-quarter in 2026–2027 - and allows MBS to continue its natural runoff without full reinvestment, the balance sheet could see a net reduction of about $50–100 billion/year.
But fiscal gravity will pull back: With a deficit of ~$2.3 trillion/year and continuous Treasury debt issuance, the natural demand for reserves will grow in line with nominal GDP at ~5%/year. Currency in circulation will add ~$120 billion/year. If the Fed cuts RMP too aggressively without fast enough regulatory reform, the system will force the Fed to restart or readjust - the net effect being that the balance sheet will barely shrink.
The result: Two opposing forces - Warsh wanting to trim, fiscal gravity pulling to expand - will yield a balance sheet at the end of 2027 not much different from today, but with a cleaner composition: fewer MBS, more T-bills, and a lower RMP pace.
The $6.2–6.6 trillion range accurately reflects that tension: low enough to say Warsh achieved something meaningful in terms of direction, high enough to say fiscal gravity and plumbing constraints did not let him go further.
What would prove me wrong:
If the balance sheet falls below $6.2 trillion - meaning regulatory reform happens faster than expected (central clearing of repos, further SLR easing), the fiscal deficit narrows significantly through DOGE or a bipartisan budget agreement, and the FOMC aligns with Warsh faster than I think.
If the balance sheet rises above $6.6 trillion - meaning one of the three worst-case scenarios from Part V has occurred: repo stress forces the Fed to restart RMP at a faster pace, TGA dynamics in Q4/2026 or Q1/2027 cause a shock severe enough to force an FOMC response, or a worse-than-expected fiscal trajectory drives a sharp, unplanned increase in Treasury issuance.
Three Indicators to Watch Weekly
No need to read Warsh's speeches to know where the system is headed. Just watch three numbers:
EFFR – IORB spread: Currently at 1 bps - in the "watch carefully" zone. If this spread widens to 5–8 bps, the system is becoming more comfortable and Warsh has room to trim. If it continues to narrow toward 0 or reverses, RMP cannot be reduced further without risk.
FFR – SOFR spread: Currently narrowing toward the December 2024 peak. If this spread widens again - meaning banks are flooding repo with excess cash - it is a sign that the buffer is growing thicker. If it continues to narrow or reverses, the system is tightening.
SRF daily usage: If usage hovers around $0–2 billion on normal days (not month-end or quarter-end), the market is intermediating well on its own. If usage rises steadily mid-month, it is a signal that dealers are using the backstop more frequently - and Warsh will have to keep RMP unchanged instead of trimming.
When those three figures improve in tandem - spreads widen, buffers thicken, and SRF is near $0 - that is when Warsh can start trimming more aggressively in line with his agenda. When they deteriorate in tandem - spreads narrow, SRF rises mid-month, and SOFR approaches IORB - that is when fiscal gravity is winning over philosophy, and the Fed's balance sheet will not be able to shrink.
The funding market does not lie. It is just often read with the wrong tools.
Monitor EFFR, SOFR, and SRF - not the 10Y yield - every week. When they start to flicker, the story of the month has already been written.