Fully unlocked free articles this week:
"Nothing quite lines up perfectly in China, as the exact management of China's reserves and the non-reserve foreign assets of the PBOC are treated as state secrets." - Brad Setser, Whitney Shepardson Senior Fellow, Council on Foreign Relations.
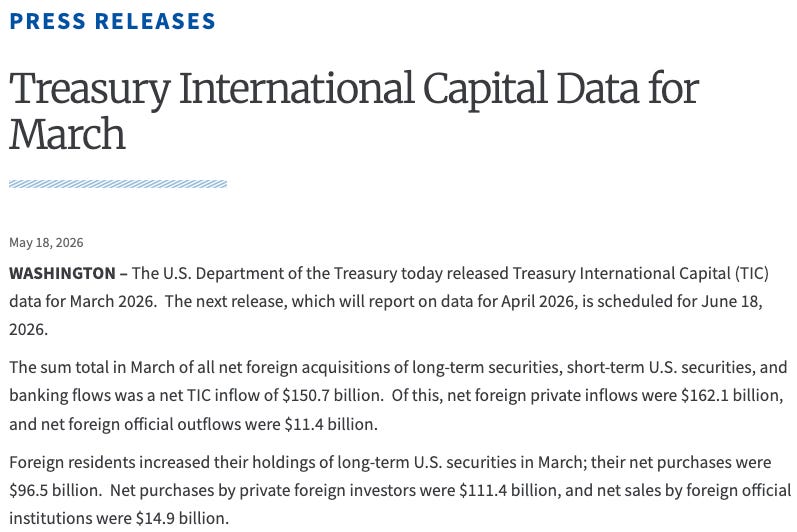
Some numbers appear so regularly that the market begins to accept them as truth. Every month, when the US Treasury releases the TIC data, a small line is pulled from the statistical tables and turned into a headline: China holds $652 billion in Treasuries - the lowest level in nearly two decades.

From there, a familiar narrative is constructed.
China is dumping US Treasuries.
China is exiting the dollar.
China is preparing to use Treasuries as a 'financial nuclear weapon'. And if Beijing decides to sell aggressively one day, the US bond market will shake.
The narrative sounds highly plausible. It has data, geopolitics, US-China tensions, and the image of a giant creditor withdrawing from its rival's financial system.
But the problem is: the $652 billion figure is not wrong - it is just incomplete.
It measures the portion of Treasuries directly recorded under China's name in the custodial system visible to the US. It does not fully measure assets that may be held through Brussels, Luxembourg, Paris, London, or Toronto. It does not fully capture Agency securities. It does not capture the full role of state banks. Nor does it fully reflect the semi-official vehicles that sit between foreign exchange reserves, state investment, and geoeconomic policy.
In other words, what is disappearing may not be China's USD assets. What is disappearing is the ability to see them in US data, and
This is what makes this week's story much more complex than the 'China dumps Treasuries' headline.
If China were truly abandoning the dollar, we would see a major shift in currency exposure: USD falling sharply in reserves, with gold, the euro, or RMB assets rising enough to replace it, and the national balance sheet becoming less dependent on the dollar ecosystem. But what the data suggests is different: China remains deeply tied to USD assets, only the way they are held has changed - less visible, shorter-term, more dispersed, and less dependent on US custodians.
This is not de-dollarization in the classic sense.
This is de-dollarization, and
And here lies the paradox: Beijing wants to reduce the risk of being seen by the US, controlled by the US, or in an extreme scenario, having its assets frozen by the US like Russia after 2022. But at the same time, China remains locked in the dollar system by its own massive trade surplus. Every year, trillions of dollars of goods leave China; that surplus has to go somewhere. If it does not go into long-term Treasuries, it could go into T-bills. If it is not held directly in New York, it could be held through Euroclear, Clearstream, Canada, or state banks. But it cannot simply transform into a complete non-dollar system yet.
Therefore, the right question is not just:
"How much in Treasuries does China still hold?"
Therefore, the question is not:
"How dependent is China still on USD assets - even if those assets are no longer in places easily visible in US data?"
And the more important question for the market is:
"Is the real risk a dramatic sell-off, or a quiet withdrawal from the role of marginal buyer just as the US has to issue an additional $1.5-2.0 trillion in new Treasuries each year?"
This week's article goes through seven layers of analysis:
Layer I - TIC: what this system measures, and why it does not fully measure the ultimate owner.
Layer II - Belgium and Treasuries: why the $652 billion figure is only the starting point.
Layer III - 'Oh, Canada': why Agency securities might be the missing piece overlooked by the market.
Layer IV - Institutional Architecture: USD assets do not sit in a single vault.
Layer V - Aggregating the Numbers: separating Treasuries, reserve-related assets, and broader USD exposure.
Layer VI - PBOC swap lines: the ambition to build a parallel liquidity network and its practical limits.
Layer VII - Why a Sell-off is Impossible: China is a prisoner of its trade surplus and USD balance sheet.
Layer VIII - The Real Risk: not a noisy sell-off, but buying less quietly.
By the end of the article, the answer will not be as simple as the headline.
China is not dumping all its Treasuries. Nor has China abandoned the dollar.
China is not dumping Treasuries. restructuring how it holds USD assets to make them harder to see, harder to freeze, and less dependent on the US custody system.
The risk, therefore, does not lie in a 'dump Treasuries' button. The risk lies in the old marginal buyer quietly stepping off the stage - just when the Treasury stage needs an audience more than ever.
LAYER I - THE TIC SYSTEM: DESIGN AND CORE LIMITATIONS
1.1. What TIC Measures - and What It Does Not
Treasury International Capital System - abbreviated as TIC, or the US Treasury's Treasury International Capital system - is a monthly reporting system operated by the US Treasury since 1934 to track cross-border capital flows entering and leaving the US financial market.
The core principle of TIC is quite simple: the custodiansThe greater, quieter, and more realistic risk is that China broker-dealers and US-based financial institutions must report the amount of US assets they hold in custody for foreign investors. But the key point is: TIC primarily measures where assets are held in custody - meaning custodial location - rather than necessarily measuring accurately the ultimate owner - meaning beneficial ownership, and
In other words, if a country holds Treasuries directly through the US custodial system, those assets may appear under that country's name in the TIC data. But if the same amount of Treasuries is held through an intermediary custodian in Belgium, Luxembourg, the UK, France, or Canada, the TIC data may record those assets under the name of the intermediary custodial country - even though the ultimate economic owner may be a different entity.
This is the core limitation of TIC: it is highly useful for tracking where US assets are held, but not always sufficient to know exactly who actually owns those assets.
If China buys Treasuries and has the Federal Reserve Bank of New York hold them, that figure appears in the 'China' row of the TIC table. But if China buys Treasuries and has Euroclear in Belgium or Clearstream in Luxembourg hold them, that figure appears in the 'Belgium' or 'Luxembourg' row - even though the actual owner is still China.
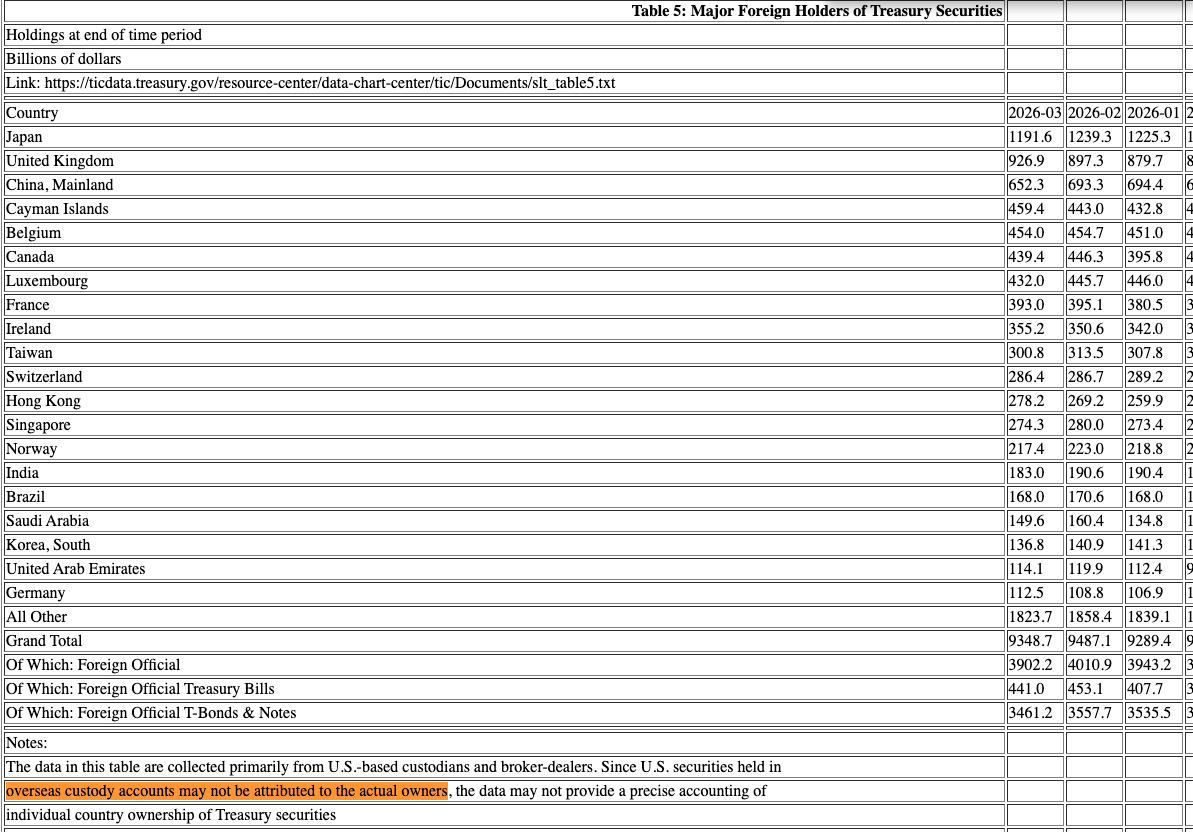
The US Treasury does not hide this. In the TIC FAQ section, the Treasury clearly states:
"The TIC data is organized by the country of the custodian, not the country of the ultimate holder."
But that disclaimer is ignored every month when the headlines are written.
1.2. Why SAFE Chooses Foreign Custodians - and the Most Important Reason is February 2022
Euroclear in Brussels and Clearstream in Luxembourg are the two largest international central securities depositories in the world, processing transaction volumes of up to tens of trillions of dollars annually.
Major central banks often use these infrastructures because they offer many advantages: assets can be flexibly used as collateral, transactions across multiple asset classes can be cleared more efficiently, transaction privacy is higher, and the European time zone is convenient for cross-market reinvestment activities.
Simply put, Euroclear and Clearstream are not just places to 'hold' securities. They are a vital part of the global financial plumbing - where assets can be held, rotated, collateralized, and reinvested more flexibly than if they were sitting directly in the US custody system.
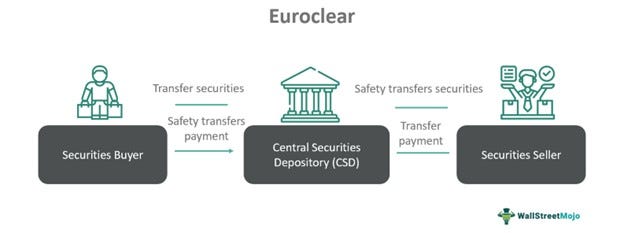
More importantly: SAFE (State Administration of Foreign Exchange - China's State Administration of Foreign Exchange) holds a stake in Euroclear. This is direct institutional evidence of a connection.
But on 26/2/2022, that assumption changed completely. When the G7 announced the freezing of approximately $300–350 billion in reserves of the Central Bank of Russia, the market realized one thing: foreign exchange reserve assets do not only carry price risk, interest rate risk, or liquidity risk. They also carry custody risk - meaning the risk that assets still exist on paper, but the owner no longer has full rights to use them.
The notable technical point lies with Euroclear. When the frozen Russian bonds here matured, the principal and interest cash flows were not transferred normally to the owner. Instead, the funds were held in non-interest-bearing or restricted deposit accounts. In other words, the assets have not been written off, but their economic functions - generating liquidity, earning interest, reinvesting - have been paralyzed.
For China, this is a very concrete lesson. If a central bank's reserves can be frozen through the custodian system, then the issue is no longer just what assets to hold, but also where to hold them, through whom, and under which jurisdiction, and
That is why after 2022, diversifying assets across multiple custodians is no longer just a technical choice. It has become a geopolitical risk management strategy.
TIER II - THE REAL MAP: HOW MUCH IS CHINA ACTUALLY HOLDING AFTER THE BELGIUM ADJUSTMENT
2.1. Why $652 billion is only the starting point
When the press says China is holding $652 billion in Treasuries, that figure is not wrong. But it only measures a very narrow part: the amount of Treasuries recorded directly under the name "China, Mainland - Mainland China" in the U.S. Treasury's TIC system.

The issue is that TIC primarily measures the custody location, and does not fully measure the ultimate owner. If China holds Treasuries through New York, those assets may appear under the China line. But if the assets are held through Euroclear in Belgium, Clearstream in Luxembourg, or a custodian in Canada, the UK, France, then they may appear under the names of those jurisdictions - even though the ultimate beneficial owner could still be China.
Therefore, the right question is not:
How many Treasuries does China still have in the TIC's China line?
Therefore, the question is not:
How many U.S./USD assets does China still hold if we include those held through foreign custodians and other state institutions?
This is why the $652 billion figure is only a starting point, not the final answer.
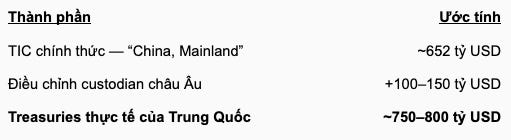
2.2. Actual bond holdings could be close to $750–850 billion - Why Belgium was once the best trail
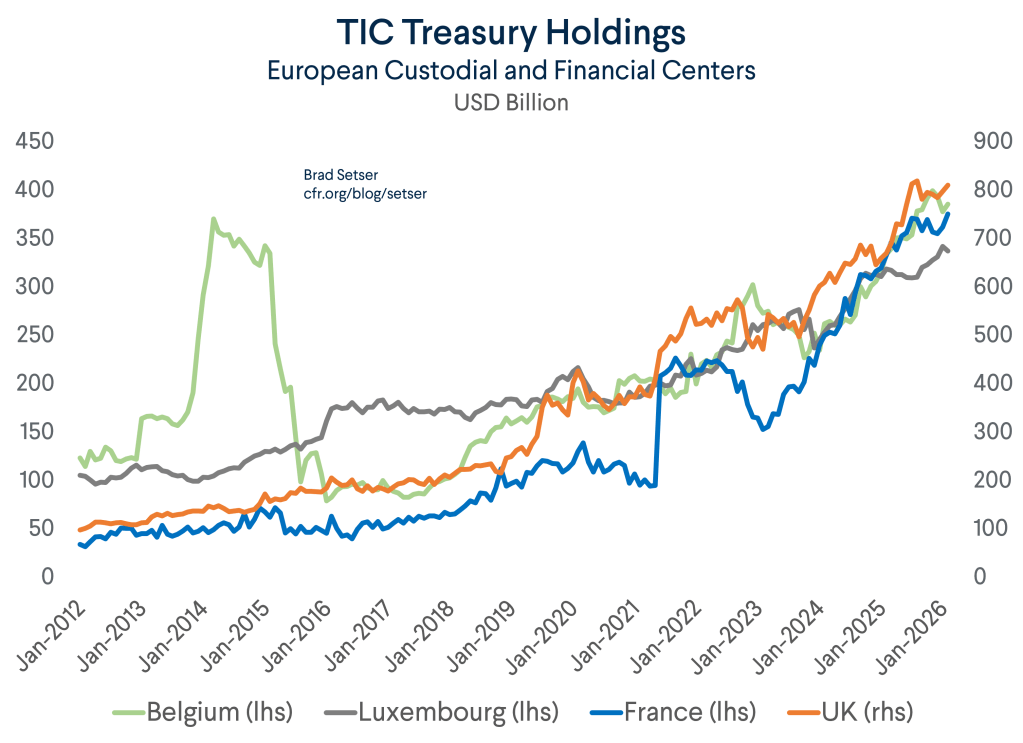
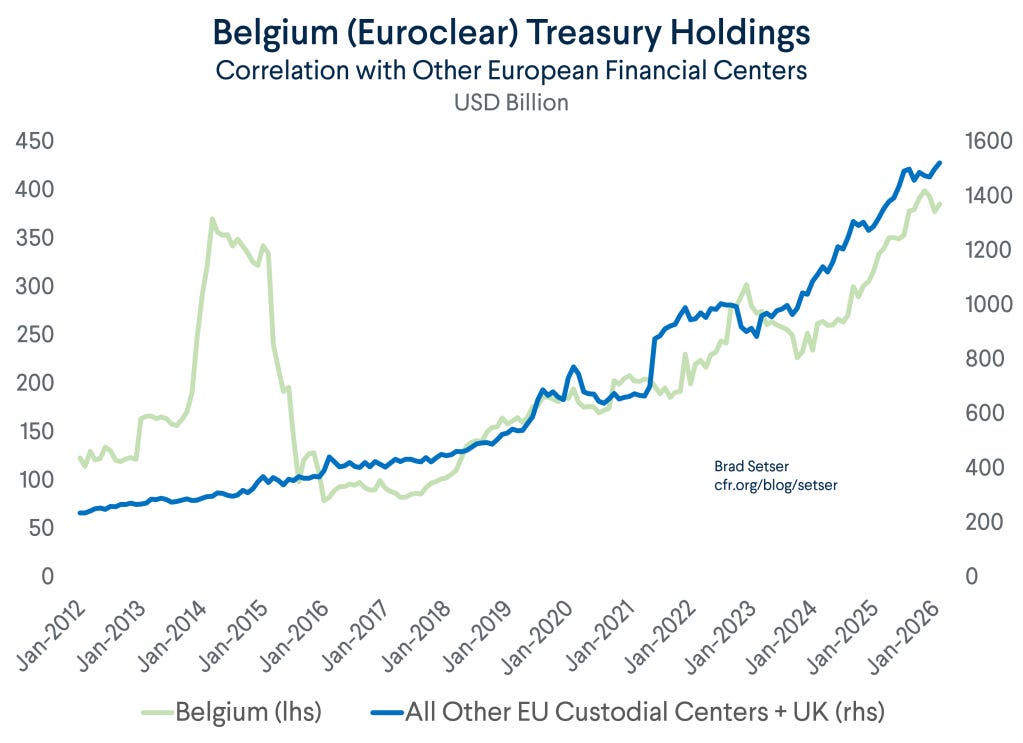
Previously, Belgium/Euroclear was the most important trail to read the Treasuries China held outside U.S. custodians. The period of 2014–2016, holdings in Belgium moved quite closely with fluctuations in China's reserves, especially when Beijing sold assets to support the yuan. Therefore, "Belgium Adjustment" was once a reasonable way to estimate China's Treasuries that did not appear directly under the "China" line in TIC.
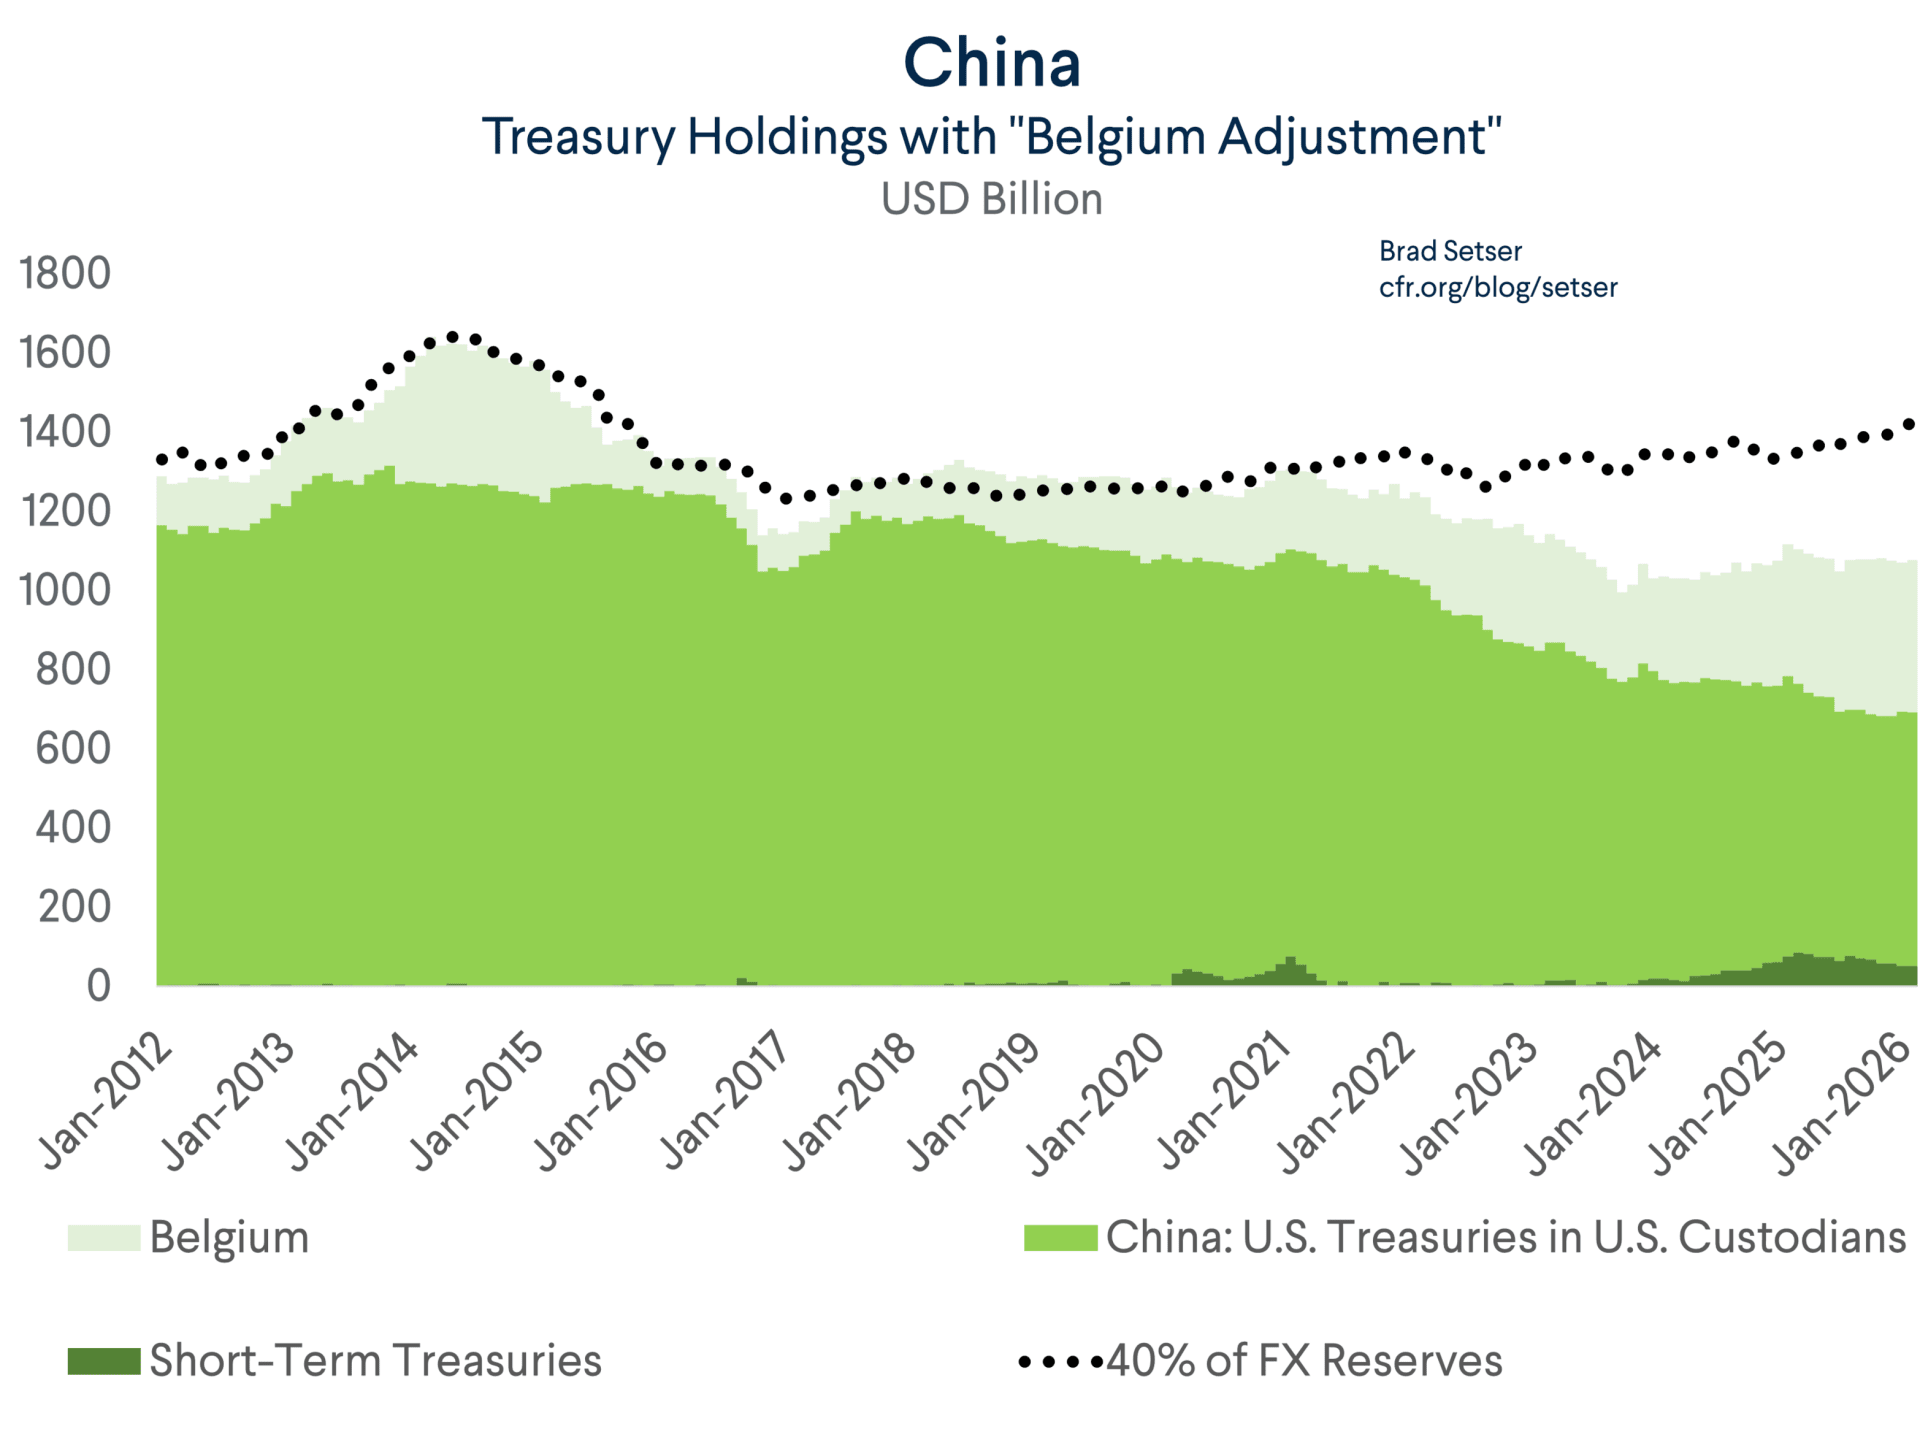
However, after 2020–2022, just looking at Belgium is no longer enough. The lesson from the G7 freezing Russian reserves gives major countries a clear incentive not to concentrate assets in a single custody point. For China, that means Treasury assets may have been more widely dispersed across multiple European financial centers.
Data shows that holdings in Belgium, Luxembourg, France, and the UK have all risen sharply in recent years. Meanwhile, Treasuries recorded directly under China's name at U.S. custodians have declined. This does not prove that the entire increase in Europe belongs to China, but it shows one important thing: the "China" line in TIC is increasingly insufficient to represent China's entire Treasury exposure.
My personal conservative calculation is to add about $100–150 billion in Treasuries from these European custodians to the official TIC figure.
The key point is: China may have reduced its . compared to its 2013 peak. But that does not mean they have abandoned USD assets. A portion of the assets may have shifted to foreign custodians, T-bills, short-term assets, or Agency securities.
long-term Treasuries
China may be holding fewer long-term Treasuries, but not necessarily fewer dollars.
TIER III - "OH, CANADA": AGENCY SECURITIES AND THE CANADA MYSTERY
3.1. The overlooked piece: Agency securities
If we only look at Treasuries, we are still missing an important part of the picture.
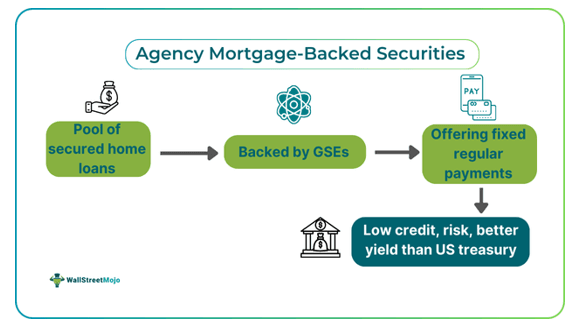
In the portfolios of major foreign exchange reserve managers, U.S. assets do not only consist of U.S. Treasuries. Another important asset class is Agency securities - meaning securities issued or guaranteed by U.S. government-sponsored enterprises, most notably Fannie Mae, Freddie Mac and other government-sponsored enterprises others.
Agencies are attractive because they sit very close to Treasuries on the safety scale: high liquidity, low credit risk, implicit guarantees from the U.S. government, but they typically pay higher yields than Treasuries of the same maturity. Simply put, if Treasuries are the safest zone of the USD system, then Agencies are a way to earn a bit more yield without straying too far from that safe zone.
The key point is that the logic of shifting custody locations does not only apply to Bonds. If U.S. Treasuries can be moved from the U.S. custody system to Belgium, Luxembourg, France, or the UK, then Agency securities can also go through a similar pipeline.
The only difference is that in the Treasuries story, the prominent trail is Belgium/Euroclear. While in the Agencies story, the more notable name is Canada, and
This is why Agency securities are an indispensable piece of the puzzle. China's Agency holdings in U.S. custodians data once reached over $250 billion, then fell to around $150 billion after 2022. If we only look at the "China" line, we might conclude that China sold more than $100 billion Agencies.
But that interpretation might be too simplistic. At the same time that China's direct Agency holdings declined in U.S. data, holdings in Canada and several European custodial centers rose significantly. This raises an important possibility: a portion of the Agencies did not disappear from China's portfolio, but was simply shifted to be held through foreign custodians.
In other words, after Belgium in the Treasuries story, it is Canada's turn to become the trail to watch in the Agencies story.
If Treasuries show that China can make USD assets less visible through Europe, then Agencies show that the same logic may be playing out through Canada.
3.2. Canada and the unusual trail
The strangest point in the Agency holdings data lies in Canada, and
From around 2020–2021, Canada began to sharply increase its volume of , recorded in the TIC. This trend continued through 2024. During the same period, Agency holdings recorded directly under China's name fell sharply - from above $250 billion to around $150 billion after 2022.
This pattern is highly notable. Looking only at the "China" line, one might conclude that China sold over $100 billion in Agencies. But when placed alongside Canada and European custodial centers, the picture becomes more complex: the decline in China's share almost perfectly coincides with the sharp increase in Canada and EU custodial centers.
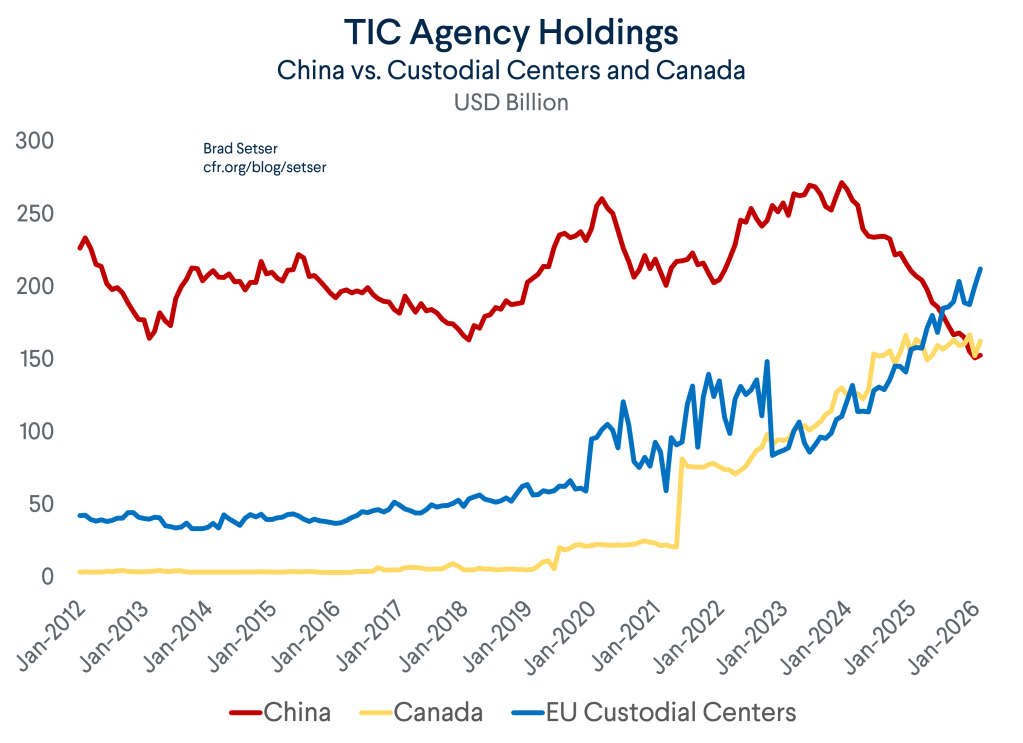
This chart does not definitively prove that the entire increase in Canada and Europe belongs to China. But it raises a crucial question: Is China actually selling Agencies, or simply shifting its custody to Canada, Luxembourg, France, and other non-U.S. custodians?
If it is indeed a custodian shift, the TIC data will no longer record those assets under China's name. They will appear under Canada or European custodial centers, even though the ultimate beneficial owner may still be a Chinese institution.
In other words, the story with Agencies is very similar to that of Treasuries: assets do not necessarily disappear from China's portfolio; they may just be changing custody addresses. This is why headlines like "China cuts U.S. holdings" can be misleading if one only reads the China line in the TIC.
3.3. Actual Agency holdings could be much higher
Based on direct TIC data, China's Agency holdings currently stand at only around $150 billion,. This is the "visible" figure under the China line. But when placed alongside Canada and European custodial centers, this figure may only be a floor, not the full picture.
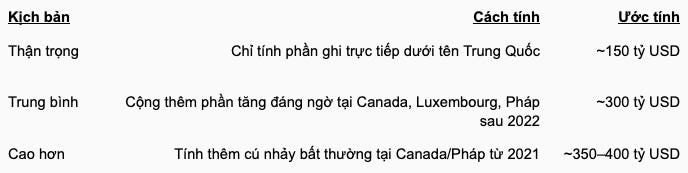
The chart below illustrates the upper-bound scenario: if we aggregate all Agency securities recorded under China, Canada, and EU custodial centers, total holdings could exceed $500 billion, and
However, this is not the primary benchmark. This is because we cannot assume that all Agency holdings in Canada and Europe belong to China. A more reasonable interpretation is to view the level of above $500 billion as an upper bound - a maximum limit to visualize the scale of the issue, rather than a central estimate.
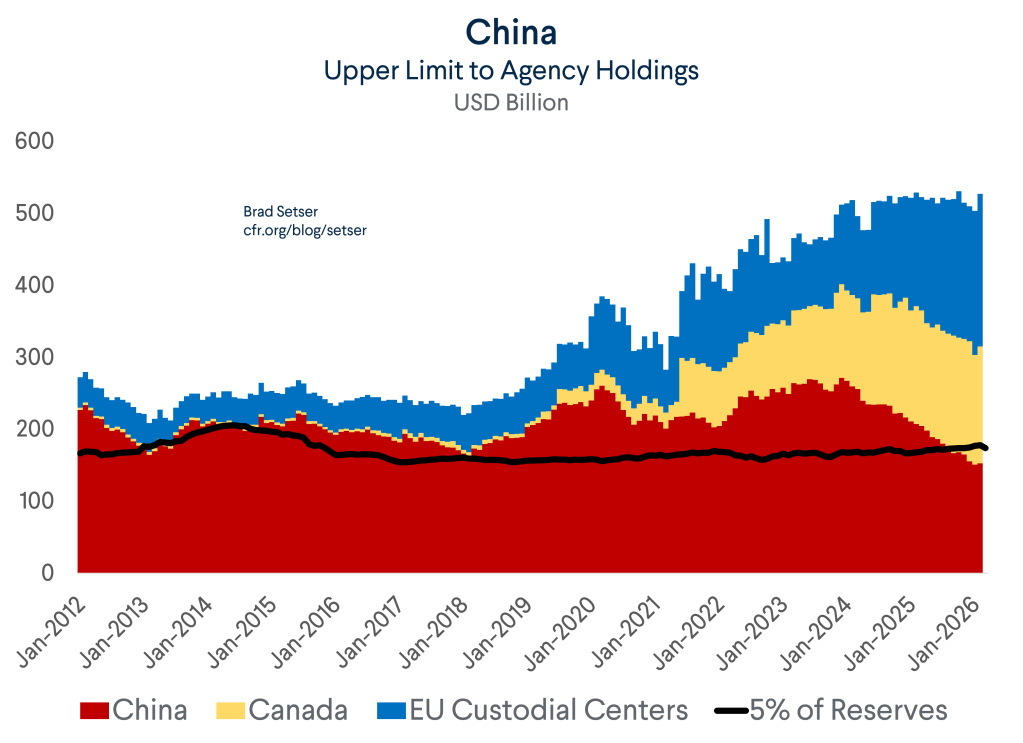
A more reasonable approach is to use an estimated range, rather than an absolute figure. $150 billion is the lowest directly observable level. $300–400 billion is a more reasonable range if a significant portion of holdings in Canada and Europe are indeed assets that have shifted custodians. Meanwhile, the level of above $500 billion should only be viewed as a very broad upper bound, used to understand the maximum scale of the issue.
The key point is not to pick an exact number. The key point is: China's actual Agency holdings are almost certainly far more complex than the China line in the TIC.
If Treasuries can be underestimated because they are held through Belgium, Luxembourg, France, or the UK, then Agencies can also be underestimated because they are held through Canada and EU custodial centers. This is why we cannot simply look at the $150 billion figure and conclude that China has exited the Agency securities market.
3.4. Conclusion: Do not just look at Treasuries
$150 billion is the visible portion. $300–400 billion may be closer to the actual picture. Above $500 billion is an upper bound that must be read with caution.
If we only look at Treasuries, we will miss a large part of China's USD asset map. Agencies show that the story is actually much more complex: China may be reducing long-term Treasuries directly in U.S. data, but it maintains exposure to U.S. assets through Agencies, T-bills, short-term deposits, and foreign custodians.
Therefore, the correct narrative is not:
China is dumping U.S. assets.
But rather:
China is restructuring how it holds USD assets - less visible, more dispersed, and harder to read in U.S. data.
This is why Agency securities are an indispensable piece of the entire "China dumping Treasuries" narrative.
LEVEL IV - INSTITUTIONAL ARCHITECTURE: USD ASSETS ARE NOT IN A SINGLE VAULT
4.1 Not just the PBOC: USD assets reside across an entire ecosystem
To understand how closely China is still tied to U.S. assets, one cannot simply look at PBOC or SAFE. China's USD assets do not sit in a single vault. They are dispersed across multiple institutional layers within the state financial ecosystem.
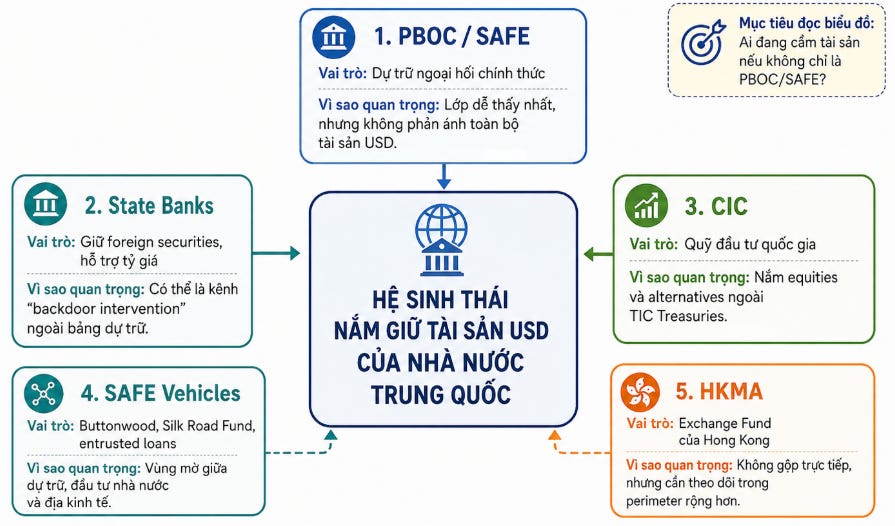
Layer 1 - PBOC/SAFE: official reserves
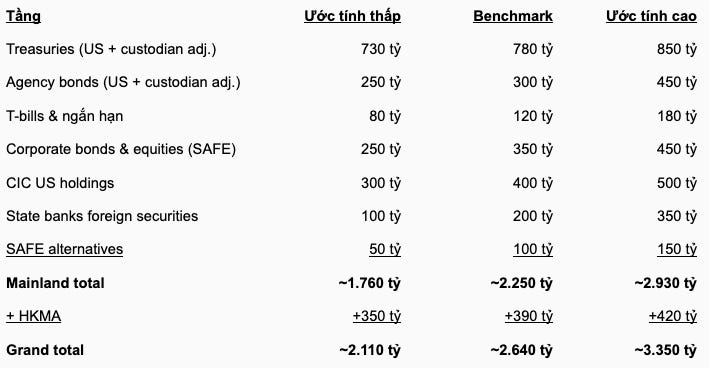
Official foreign exchange reserves: $3,410 billion (as of April 2026). If the dollar share is around 55% - a figure consistent with estimates by independent economists - then the USD asset portion in official reserves is around $1,870 billion.
Key point: this 55% ratio does not indicate a clear departure from the dollar. Although China stopped publishing its reserve currency composition in 2020, independent estimates continue to suggest that the USD share remains close to the global average (around 57-59% according to IMF COFER Q3 2025).
Layer 2 - State banks: the most important but least visible layer
This is the layer that the market underestimates the most.
The state bank group - including the Big Four (ICBC, Bank of China, China Construction Bank, Agricultural Bank) and policy banks such as China Development Bank and Export-Import Bank - holds around $400 billion in foreign securities according to Chinese banking sector data. These assets do not appear clearly in U.S. data because state banks do not have direct access to the Fed's custodial facilities.
More importantly, the rate of change. In December 2025 alone, the net foreign assets of state banks rose by $110 billion - adjusted for forwards, this could be up to $120 billion in a single month. This level is too large to be explained by normal trade activity.
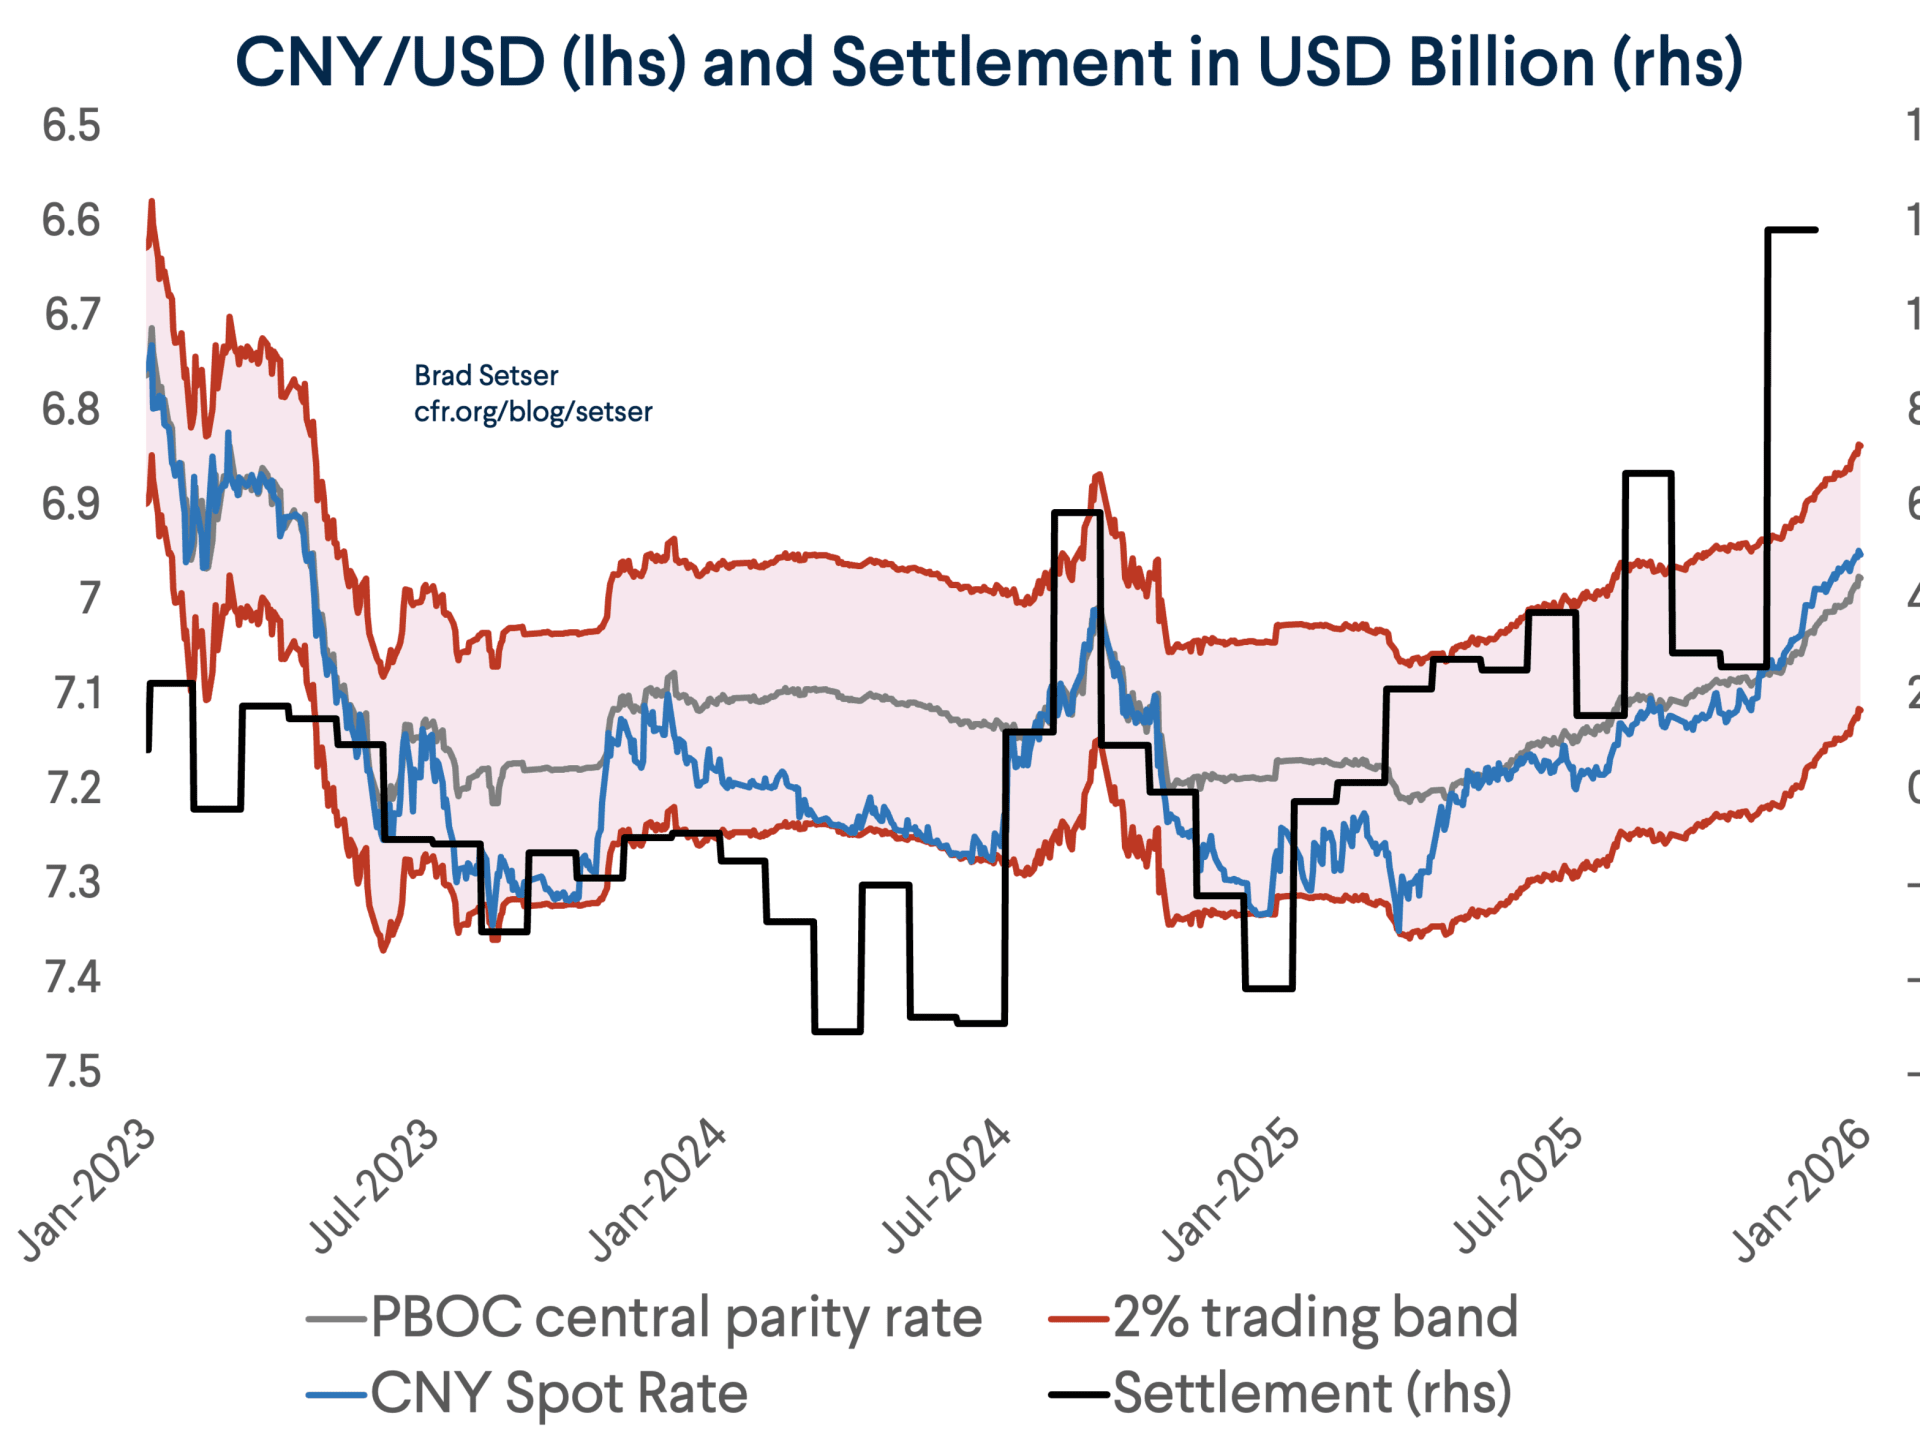
In other words, intervention has not disappeared. It has merely shifted from the highly visible balance sheet of the PBOC to the harder-to-read balance sheets of state banks.
A plausible mechanism: when the CNY faces upward pressure due to a massive trade surplus, instead of having the PBOC directly buy USD (which would increase official reserves and attract scrutiny over currency manipulation), state banks buy USD in the spot market and hold them on their balance sheets. The result: official reserves appear stable, but the actual USD assets of the state system continue to rise.
This is precisely a form of "backdoor intervention" - meaning exchange rate intervention through the back door.
Instead of having the PBOC directly buy USD and increase official foreign exchange reserves, the state banks can step in to absorb that USD volume and hold it on their balance sheets. As a result, the policy objective is still achieved - reducing upward pressure on the CNY - but this asset flow does not clearly appear on the PBOC's balance sheet.
And because those assets do not go through the PBOC's official custody system, they do not necessarily appear in the "China" line of the TIC. In other words: intervention has not disappeared; it has simply left the place where the market is accustomed to looking.
Layer 3 - CIC: sovereign wealth fund
CIC has total assets of $1.57 trillion (net assets of $1.37 trillion, according to the 2024 Annual Report published in December 2025), with a 2024 net profit of $140.64 billion - up 30.4%. This is a major sovereign wealth fund, not foreign exchange reserves in the narrow sense, but its roots are closely tied to the reinvestment of China's foreign exchange surplus.

In the portfolio international public equity of CIC, about 59% is allocated to US assets. If CIC's international portfolio size is used as a baseline, a conservative estimate suggests that CIC may hold about $350–400 billion in US assets, primarily through listed equities, private equity, infrastructure, alternatives, and a portion of fixed income, and
The key point is: this portion almost completely disappears if we only look at the Treasuries flow in TIC. TIC may show China reducing its holdings of US Treasuries, but it fails to fully capture the US assets held through sovereign wealth funds, especially investments in equities and alternatives, and
In other words, if the question is simply 'how many Treasuries does China still hold?', CIC is not that important. But if the question is 'to what extent is China's state financial ecosystem still tied to US assets?', then CIC is an indispensable piece of the puzzle.
Tier 4 - SAFE alternative vehicles and HKMA
SAFE has its own investment vehicles (Buttonwood Investment Company, Silk Road Fund-related entities) along with foreign currency entrusted loans to domestic financial institutions. Under IMF standards, these entrusted loans are not counted as official reserves, but they remain foreign currency assets coordinated by the state system.
The HKMA alone has a size of about $490 billion, with over 80% in dollar assets - approximately $390 billion. TIC counts this as Hong Kong separately, not the mainland. But in terms of the strategic financial perimeter, this is a layer that needs to be monitored within the broader picture.
Aggregate estimates
The frequently cited TIC figure ($652 billion) is less than one-third of the benchmark estimate. And the central conclusion - confirmed by the May 2026 CFR analysis when fully adjusted - is: China's total US financial holdings still hover around 50–55% of its reserves portfolio, with no clear downward trend.
The conclusion of this tier: de-visible-dollarization, not de-dollarization
This is where most commentaries confuse two very different concepts:
custody exposure - the share of dollar assets in the total portfolio
Currency exposure - the share of assets held at US custodians and observable in TIC
What is declining is custody exposure, not currency exposure. To use a simple example: if you have $1 million deposited in New York, and then transfer $700,000 to a bank in Switzerland - you have not 'de-dollarized'. You still hold dollars. It is just that To clearly see the difference, let's use a simple example: if you have $1 million deposited in New York, then transfer $700,000 to a bank in Switzerland - you have not "de-dollarized". You still hold dollars. Your assets still depend on the dollar financial system. It is just that the custody location
That is exactly what China is doing on a national scale: maintaining dollar exposure, reducing US custodian exposure, shifting from long-term Treasuries to T-bills and Agencies, and dispersing custody through Brussels, Luxembourg, Paris, London, and Toronto. This is not a currency rebellion. This is sanction risk management.
4.2. State banks: the least visible but most important layer
Among the institutional layers above, state banks is the most notable tier.
The reason is simple: PBOC/SAFE is the most visible, but also the most closely scrutinized. If official foreign exchange reserves rise sharply, the market will immediately ask: is Beijing intervening in the exchange rate? Are the newly purchased USD being reinvested in Treasuries? And is this evidence that China is still keeping the CNY weaker than market levels?
Therefore, in a state financial system like China's, not every USD necessarily goes straight onto the PBOC's balance sheet. Part of the foreign currency absorption function can be shifted to state banks - institutions that are less visible, but still within Beijing's policy orbit.
This group includes major state-owned commercial banks such as ICBC, Bank of China, China Construction Bank, Agricultural Bank of China, along with policy banks such as China Development Bank PBOC swap lines are the largest effort in that direction. In terms of scale, this network is not small. But empirical evidence shows that the market still clearly distinguishes between Export-Import Bank of China. Nominally, these are banks. But in practice, they can also act as extensions of exchange rate, credit, and capital flow management policies.
Notably, state banks are estimated to hold about $400 billion in foreign securities. In 12/2025, this group's net foreign assets increased by about $110 billion; if forwards are included, the figure could reach $120 billion in a single month. This scale is too massive to be considered normal banking activity.
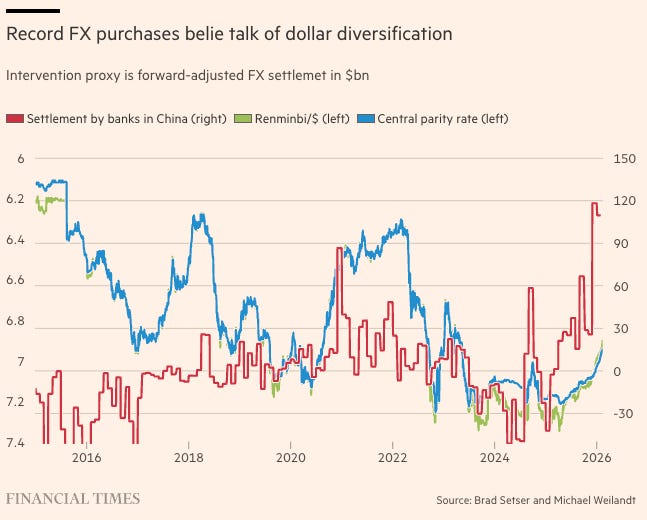
A plausible mechanism is: when the CNY faces appreciation pressure due to an outsized trade surplus, the PBOC does not necessarily buy all the USD directly. Instead, state banks can purchase USD in the market, hold foreign assets on their balance sheets, and help stabilize the exchange rate without causing a corresponding increase in official reserves.
This is precisely backdoor exchange rate intervention. Intervention has not disappeared; it has merely moved away from where the market is used to looking. USD remains within the Chinese state financial system, but does not necessarily appear clearly on the PBOC's balance sheet or in the "China" line of TIC.
long-term Treasuries
The PBOC does not need to hold all the dollars itself. As long as state banks hold them instead, the policy objective can still be achieved.
Therefore, when official reserves do not rise sharply, or direct holdings in TIC decline, one should not jump to the conclusion that China has reduced its exposure to USD assets. A portion of the assets may have simply shifted from the easily readable balance sheet of the PBOC to the harder-to-read balance sheets of state banks, and
4.3. BOP as a system that "blurs" capital flows
The issue is not just with TIC. If TIC can underreport the amount of US assets China holds, then the balance of payments can also underreport the flow of foreign assets China accumulates each year.
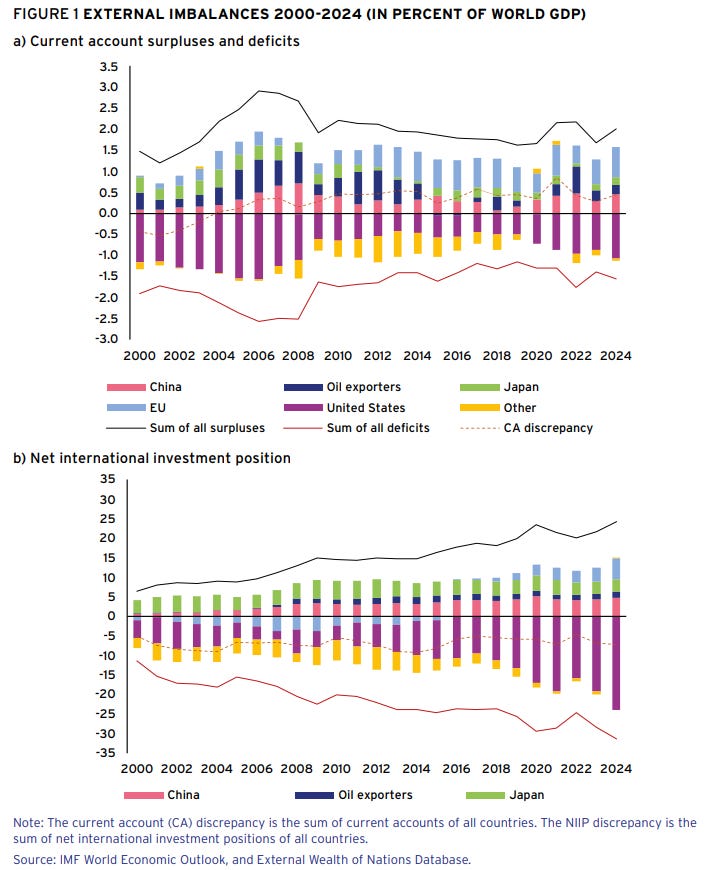
Within that picture, China is a particularly difficult case to read:
China has over $3 trillion in foreign exchange reserves.
With USD interest rates around 4%, this reserves portfolio alone could theoretically generate more than $120 billion in income annually.
Yet China reports a primary income deficit, instead of a corresponding income surplus.
The IMF also estimates that the yuan is undervalued by about 16%, partly because China's current account surplus is larger than what the IMF model considers normal.
The Economist highlights the same paradox: income from China's massive foreign assets has not increased correspondingly despite rising global interest rates.
This suggests that the story is not just about where China holds its assets, but also how China records its income and foreign asset accumulation flows, and
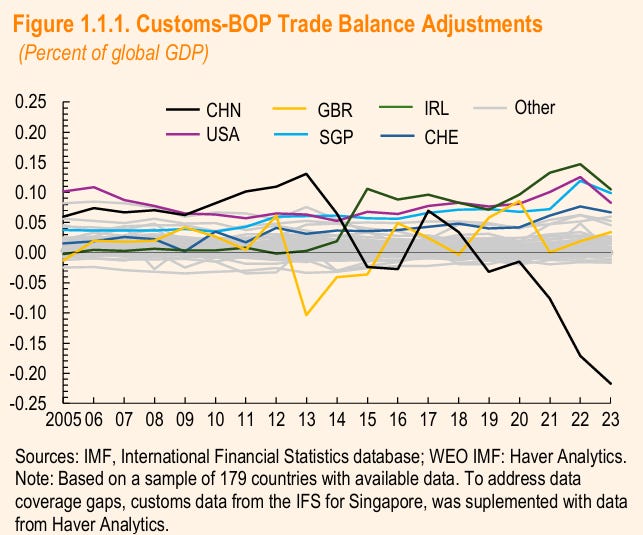
The anomaly becomes even clearer when comparing the trade balance according to customs data with the goods balance in the balance of payments. These two figures can differ due to accounting methodologies, timing of recording, global supply chains, or processing trade. But in China's case, the gap has grown so large that it raises the question: whether the balance of payments is understating the true scale of the external surplus?
Hong Kong is the next piece of the puzzle.
Hong Kong banking data shows a notable pattern: foreign currency deposits rose sharply, while liabilities to foreign banks declined. This does not look like a normal credit cycle. It resembles a system that is absorbing foreign currency liquidity rather than redeploying those flows abroad.
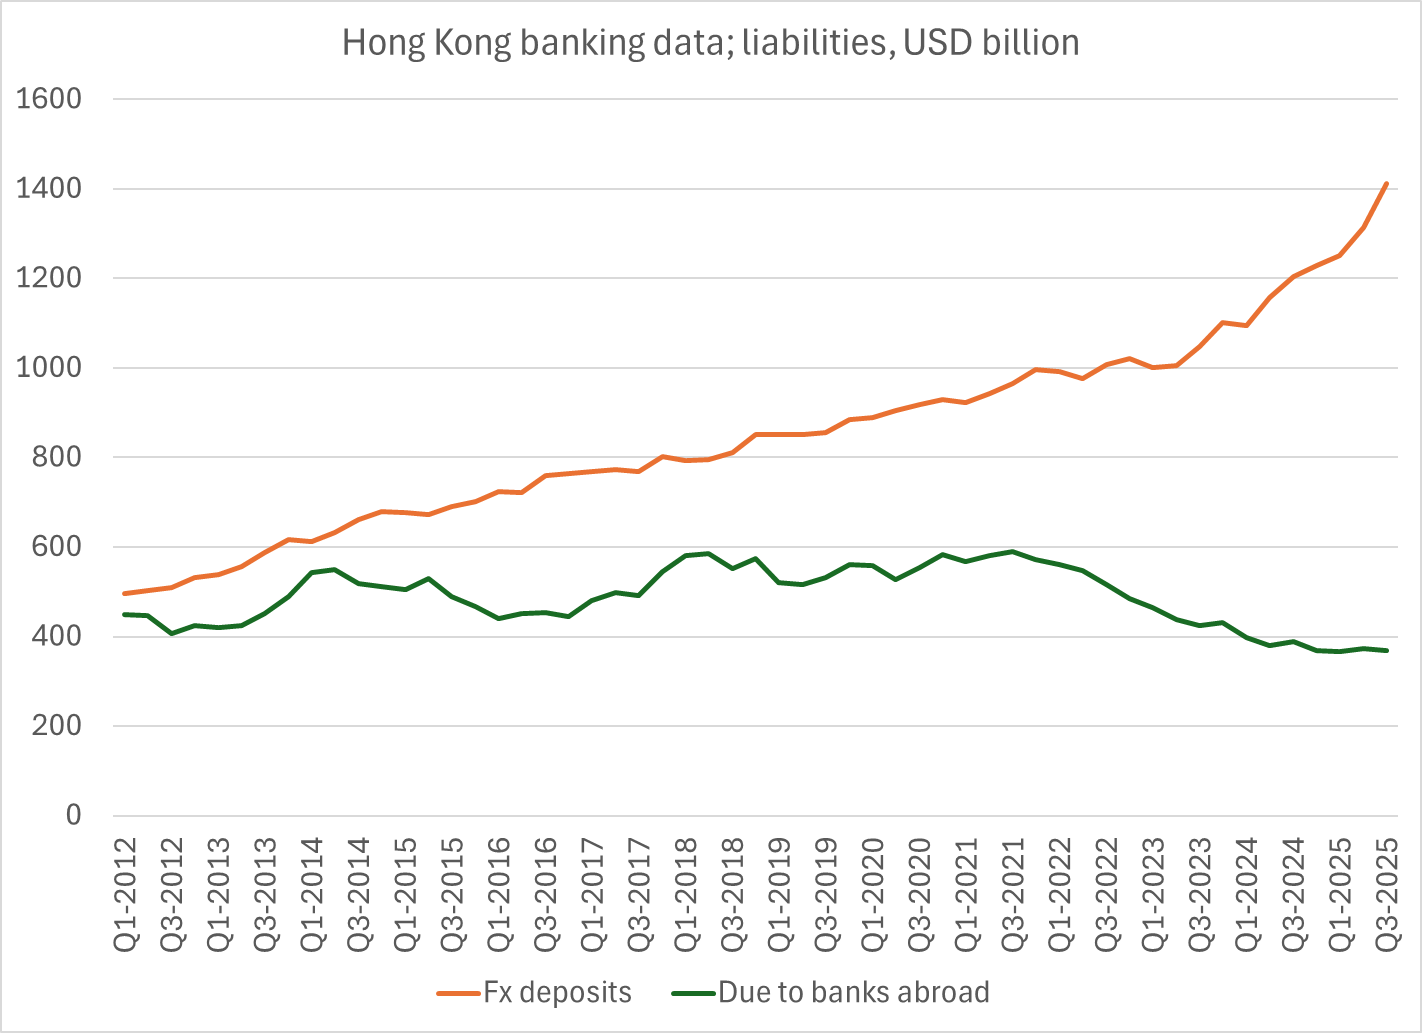
Therefore, Hong Kong is not just a temporary destination for capital outflows. It is a financial buffer in China's architecture: institutionally close enough to the mainland, but offshore enough to avoid appearing directly in familiar data streams.
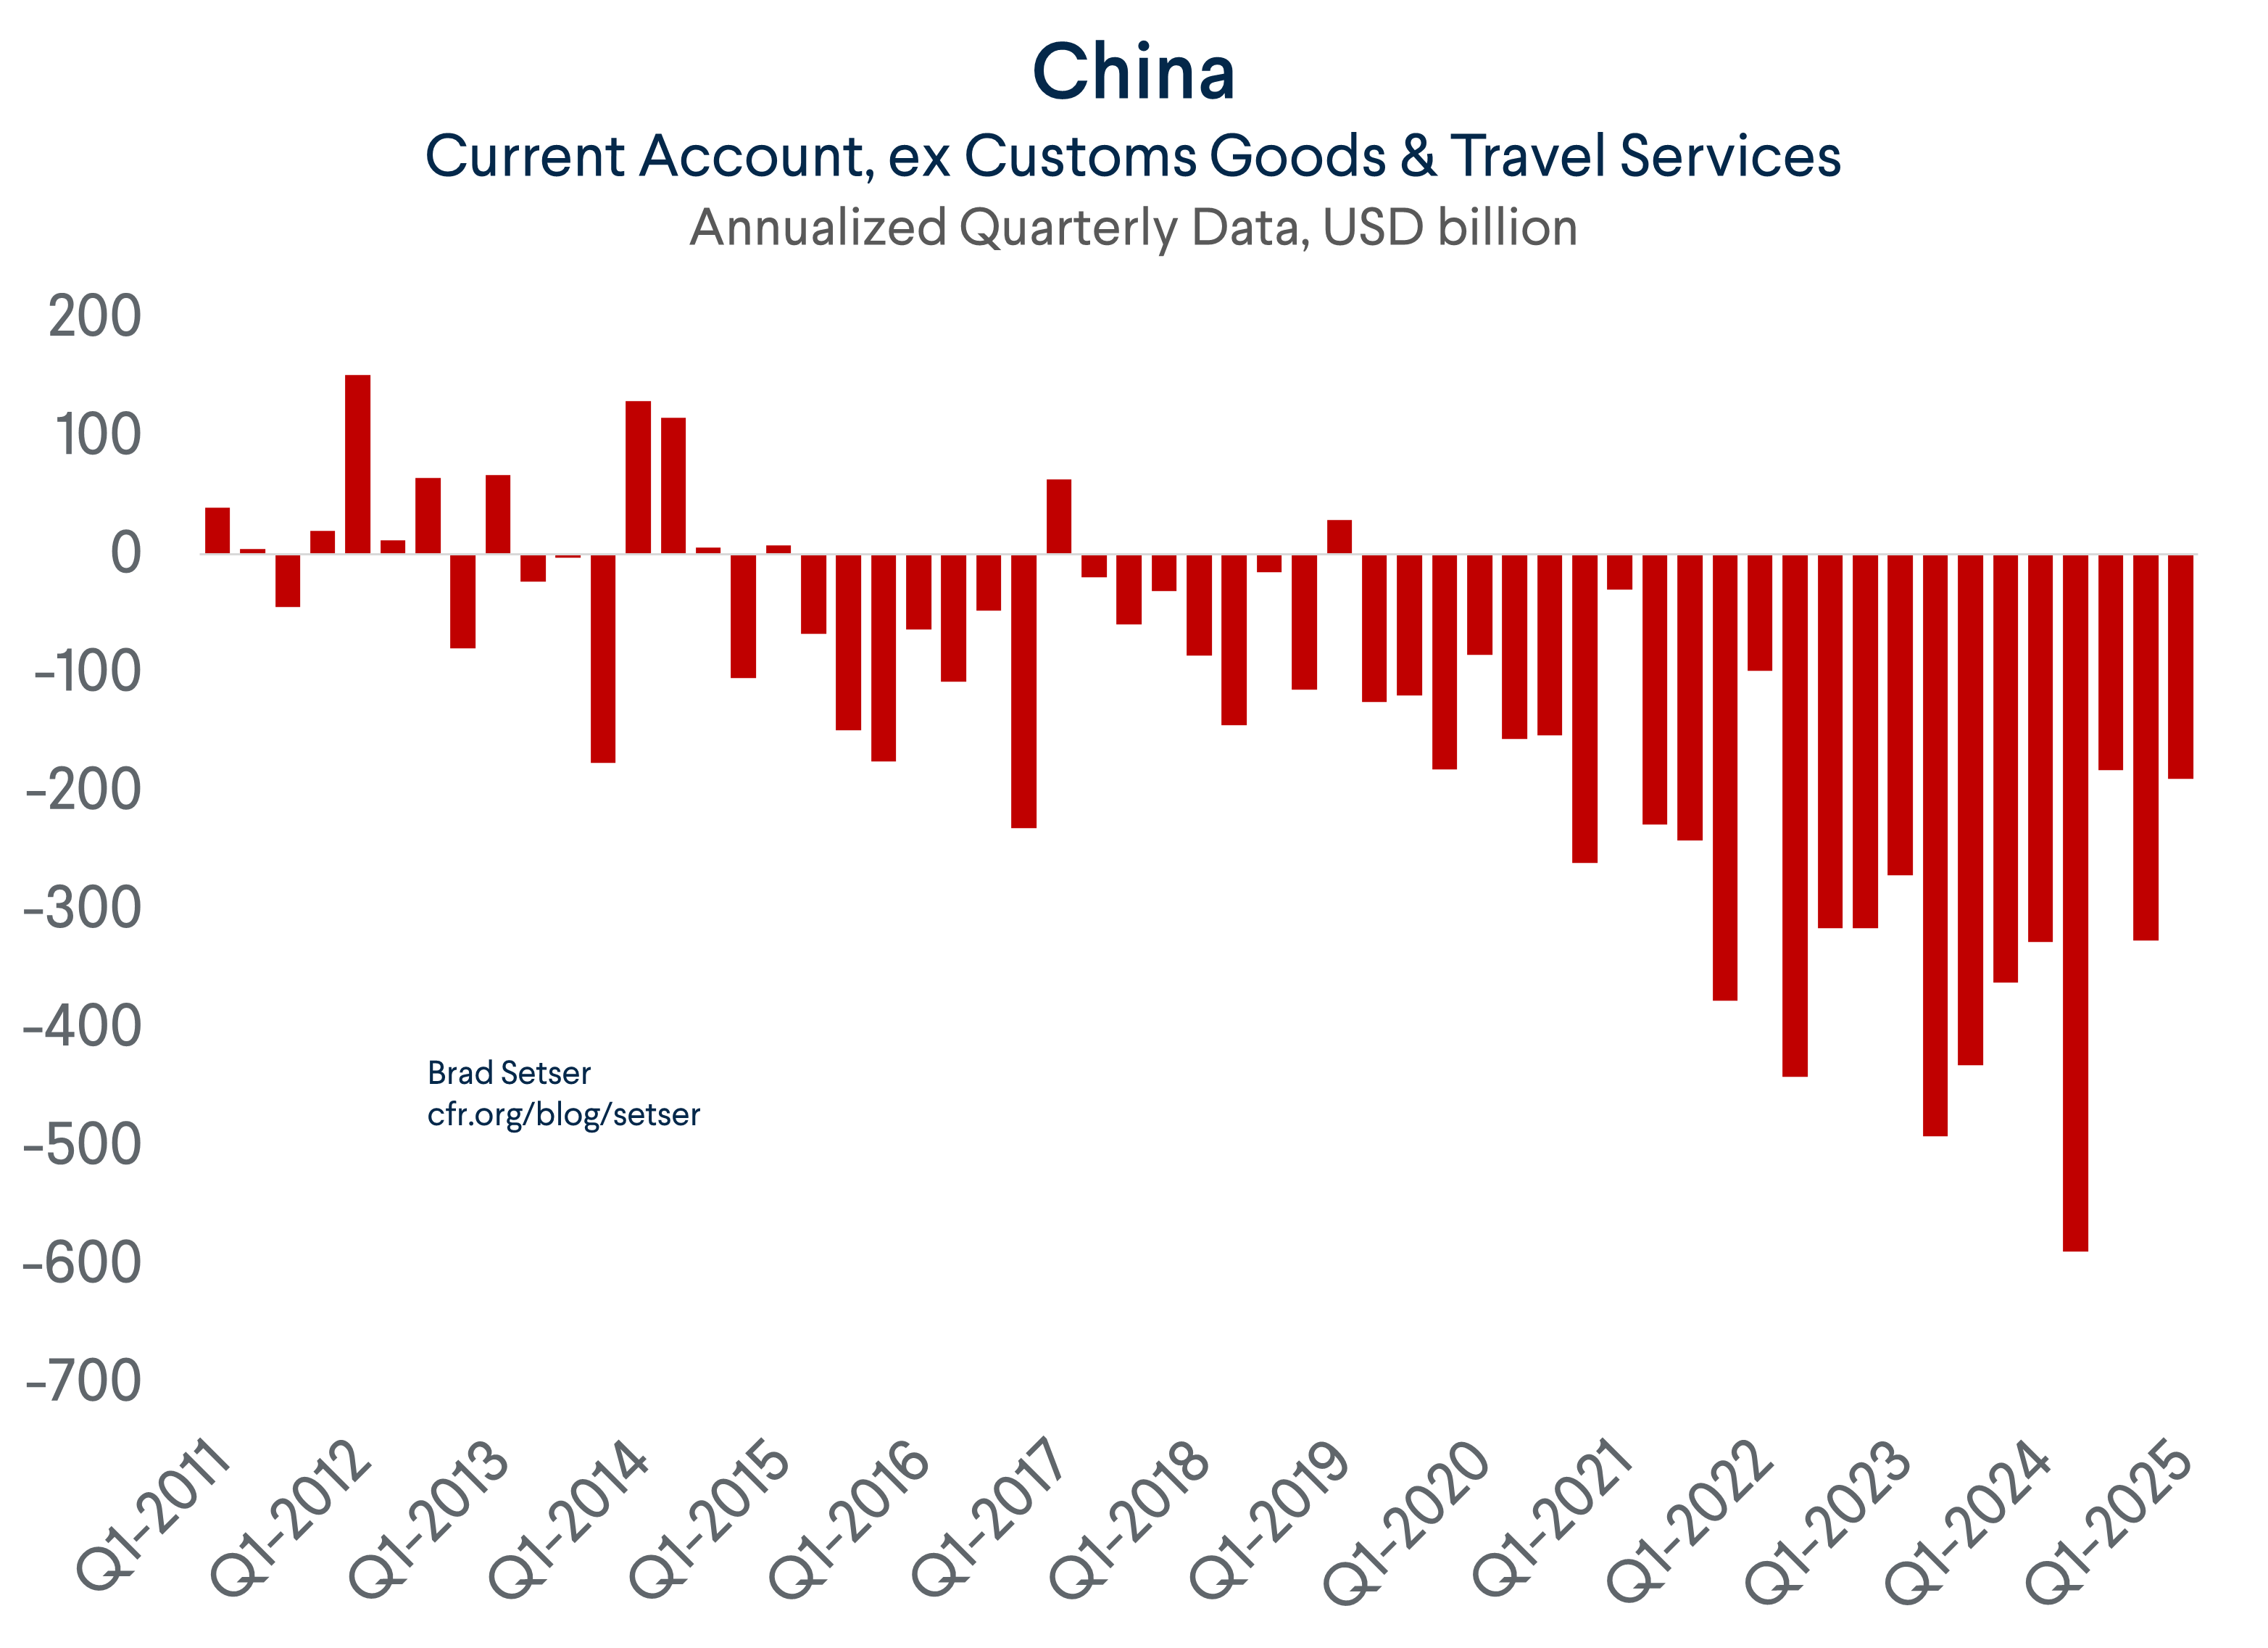
Before 2022, the errors and omissions in China's balance of payments was often deeply negative - for many years in the range of $100-200 billion - and was often interpreted by analysts as a sign of unrecorded capital outflows. Recently, this item has almost disappeared, even though signs of private capital flows and unofficial channels have not. This suggests that a portion of the capital flows may have been absorbed through other channels: state banks, Hong Kong deposits, offshore accounts, foreign custodians, or semi-official vehicles.
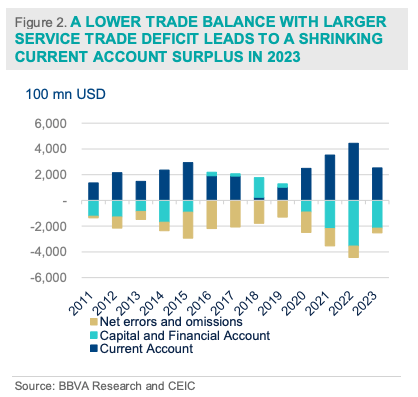
The key point is: if previously statistical discrepancies absorbed a large portion of capital outflows, and recently this item has shrunk while signs of offshore capital flows persist, we should not jump to the conclusion that those flows have disappeared. It may have simply shifted to other channels: state banks, Hong Kong deposits, offshore accounts, foreign custodians, or semi-official vehicles, and
long-term Treasuries
It is not that China has stopped accumulating foreign assets. They may still be accumulating them aggressively - it is just that an increasingly large portion is flowing through pipelines that official data struggles to capture.
4.4. Assessment: Assets are not disappearing, the measurement system is what is being obscured
From Tier IV, a simple point can be drawn: China is not a single investor, and its USD assets do not sit in a single vault.
If we only look at PBOC/SAFE, we see official reserves. If we only look at the "China, Mainland" line in TIC, we see even less. China's USD assets could be held in state banks, CIC, SAFE vehicles, Hong Kong, offshore accounts, or custodians in Belgium, Luxembourg, France, the UK, and Canada.
The issue is also not just about stock - meaning how many assets China currently holds. It is also about flow - meaning how many more foreign assets China accumulates each year. If the balance of payments also shows signs of understating the actual surplus, then both existing holdings and new asset flows become harder to decipher.
Therefore, China is making its USD assets more diversified, shorter-term, harder to freeze, and more difficult to track directly. is a misleading term. China is not necessarily slashing its exposure to the USD. What is clearly declining is direct visibility by U.S. and international data of China's true asset position.
In other words:
China's USD assets are not disappearing. They are simply shifting from easy-to-read data sheets to multiple balance sheets, multiple custodians, and more opaque accounting layers.
On a headline level, this looks like 'China cuts U.S. holdings'. But structurally, it is more akin to re-routing: the assets remain within the dollar system, just flowing through more obscure pipelines.
The conclusion of Tier IV is:
China is not just changing where it stores its USD assets. It is changing how those assets appear - or do not appear - in global data.
And if China has not truly escaped the dollar system, the next question is: can they build a sufficiently credible alternative system? That is where the story of Fed swap lines begins.
PART V - DATA CONSOLIDATION - HOW MUCH DOES CHINA ACTUALLY HOLD
After four layers of analysis, the picture needs to be separated into two very different concepts to avoid confusion:
Concept 1 - Official/reserve-related U.S. holdings: U.S. assets directly or indirectly linked to PBOC/SAFE reserves, after custodian adjustments. This is the figure for the narrow question:
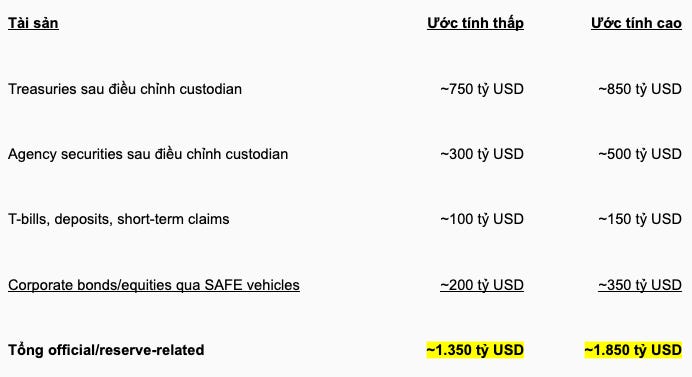
"If we only consider reserves and foreign exchange management, how much in U.S. assets does China actually still hold?" . official/reserve-related U.S. holdings $652 billion, and
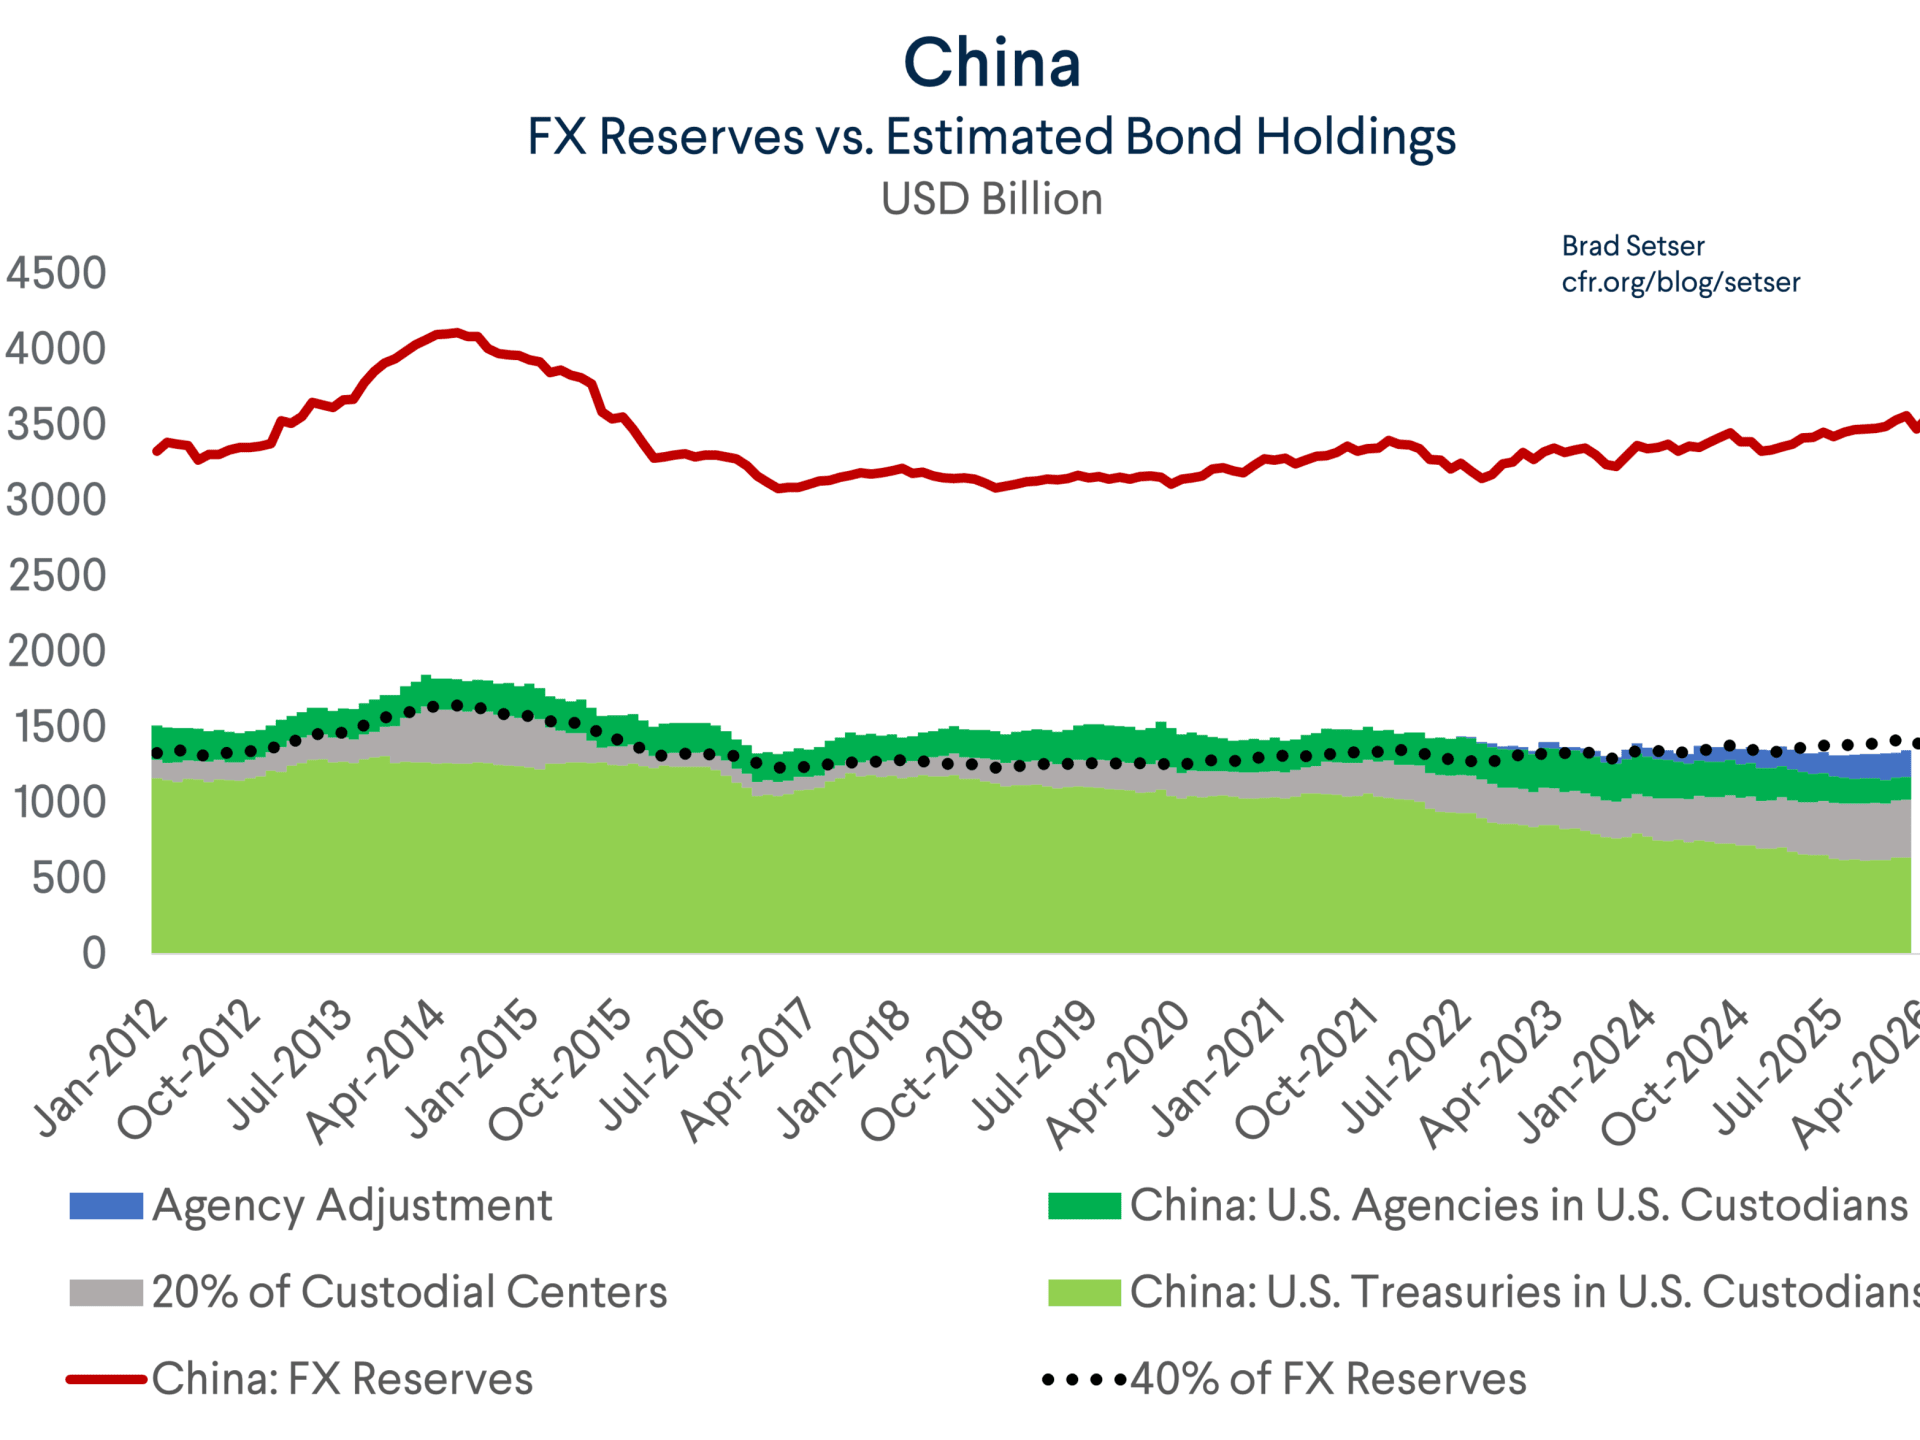
When adding Treasuries, Agencies, adjustments from custodial centers, and the Agency adjustment, China's estimated U.S. bond holdings still hover around nearly 40% of foreign exchange reserves. The chart shows that the $652 billion figure in TIC only reflects Treasuries held directly at U.S. custodians, not the entire exposure to U.S. bond assets. This chart helps clarify the issue: while Treasuries held directly in U.S. custodians have indeed declined sharply, when adding Agencies and custodian adjustments, the total estimated U.S. bond holdings does not decline in the same manner. It still hovers around nearly 40% FX reserves
for many years. In other words, China may be changing its custodial locations, maturities, and asset structures, but the data does not show an abandonment of USD assets in a simple sense.
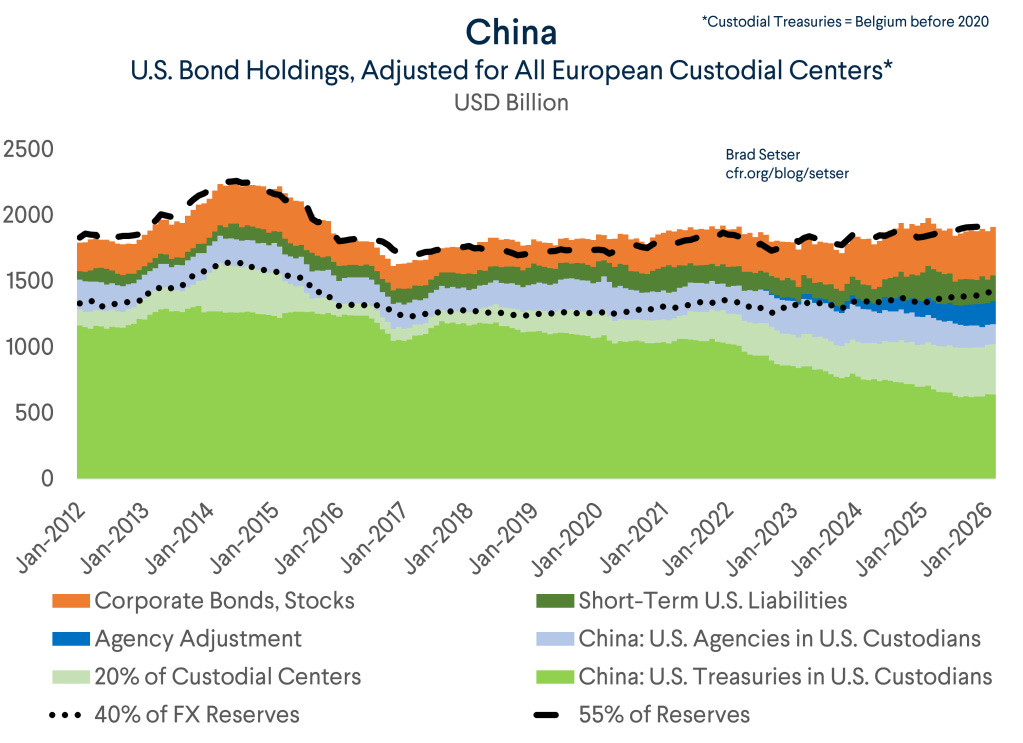
- After adding Agencies, short-term claims, corporate bonds/stocks, and assets held through European custodial centers, China's U.S. financial holdings remain around 50-55% reserves The key point here is: when accounting for all observable and estimable layers, the total U.S. financial holdings of China still hovers around50-55% of foreign exchange reserves
. Therefore, the story is not about China abruptly abandoning USD assets. Rather, the story is that these assets are increasingly less visible in the 'China' line of TIC. Concept 2 - Broader state-linked dollar exposure:
The full extent to which China's state financial ecosystem - including CIC, state banks, SAFE vehicles, Hong Kong, and off-channel flows - remains tied to USD assets.
This layer includes:CIC (China Investment Corporation)
, the sovereign wealth fund with large exposure to equities and alternatives;State Banks
, which may hold foreign securities and engage in backdoor intervention;SAFE alternative vehicles
, such as Buttonwood, the Silk Road Fund, and entrusted loans;Hong Kong Exchange Fund
, when considered under a broader strategic financial perimeter. $1,350-1,850 billion$2,000 billion CIC, state banks, SAFE vehicles, and the Hong Kong Exchange Fund state-linked dollar exposure
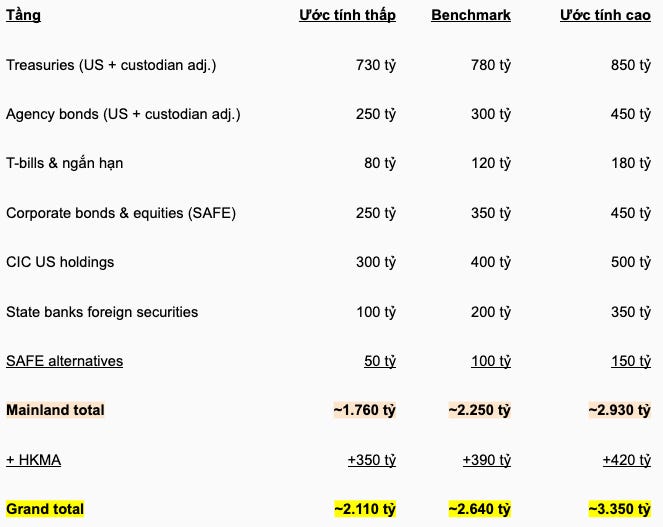
- meaning the broader dependence of China's state financial ecosystem on USD assets.
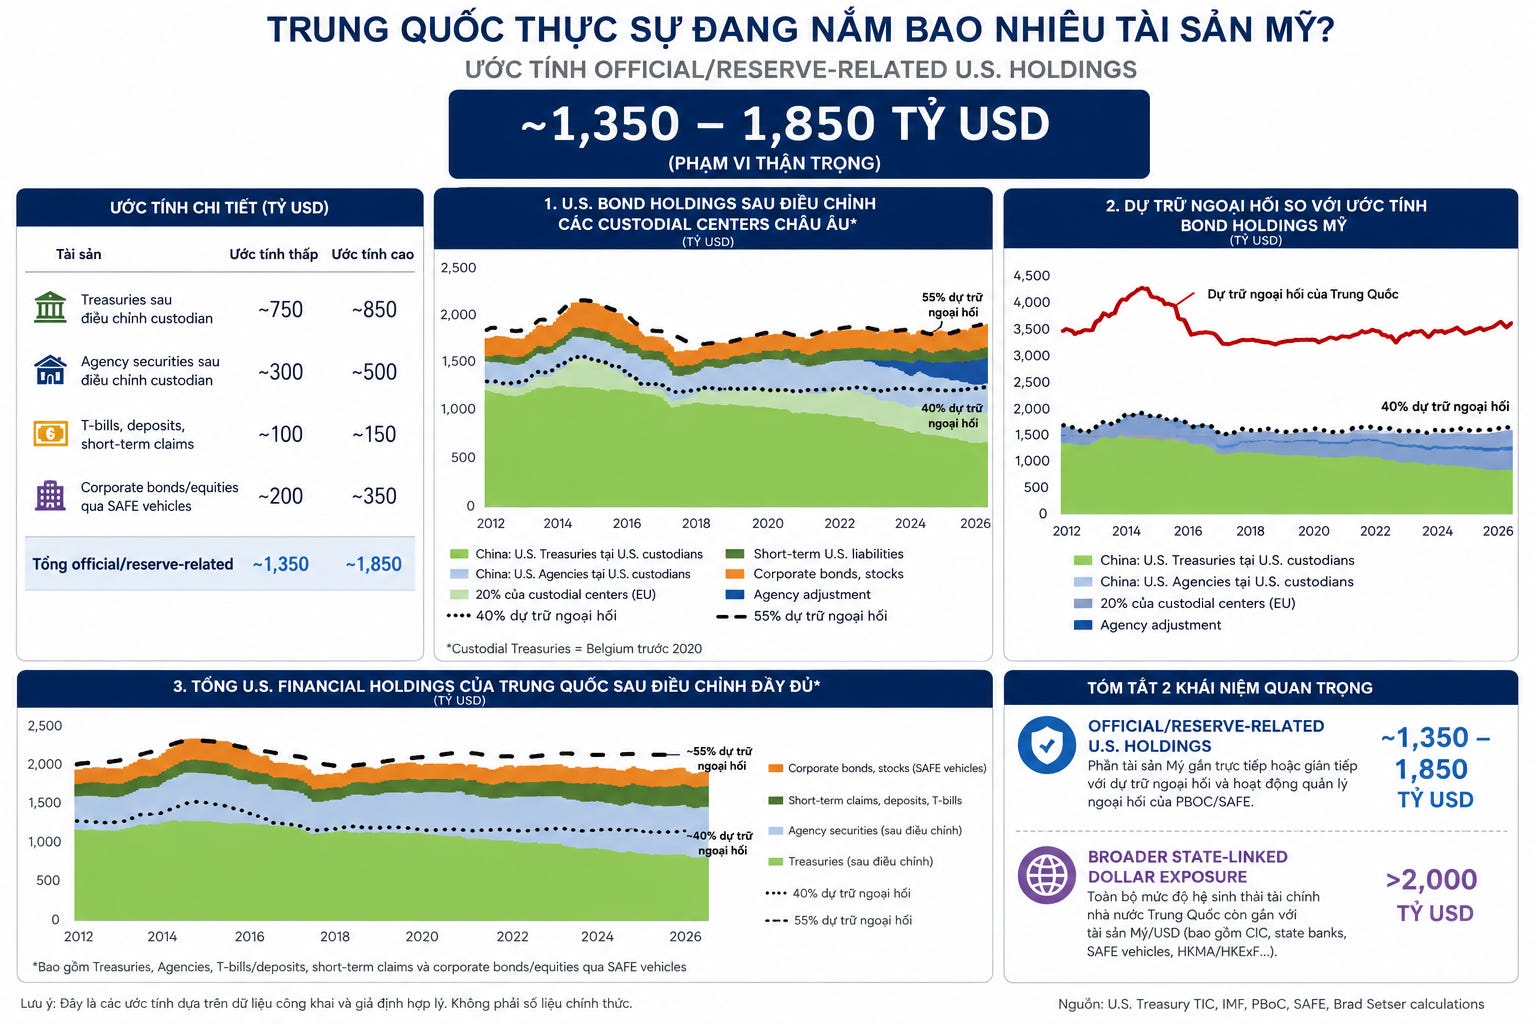
In short: restructuring how they hold USD assets to make them less visible, more flexible in maturity, more diversified in custody locations, and less dependent on the U.S. custody system.$652 billion $1,350-1,850 billion $2,000 billion
"foreign exchange reserves", we misjudge its accounting nature. The correct interpretation is:
China remains deeply tied to USD assets, but that connection is increasingly dispersed across more institutions, more custodians, and more balance sheets. From the above data layers, the central conclusion is:
China is not abandoning the dollar in the sense of sharply reducing its share of USD assets. They are making their USD assets harder to see in US data. To clearly see the difference, let's use a simple example: if you have $1 million deposited in New York, then transfer $700,000 to a bank in Switzerland - you have not "de-dollarized". You still hold dollars. Your assets still depend on the dollar financial system. It is just that the custody location
has changed.
That is exactly what China is doing at a national scale: maintaining dollar exposure, reducing US custodian exposure, shifting from long-term Treasuries to T-bills and Agencies, dispersing custody through Brussels, Luxembourg, Paris, London, Toronto - and using Hong Kong as a buffer to absorb liquidity before it finds its way to international financial assets. This is not a currency rebellion. This is geopolitical risk management
- a completely rational response after the lesson of Russia in 2022. Point 2 - This is a shift in custody, not an abandonment of the dollar PBOC swap lines are the largest effort in that direction. In terms of scale, this network is not small. But empirical evidence shows that the market still clearly distinguishes between currency exposure custody exposure
custody exposure Currency exposure = the share of dollar assets in the total portfolio -
Currency exposure Custody exposure = the share of assets held at US custodians, easily observed in TIC -
is intentionally declining de-dollarization, and
.
The assets are still dollars. But the way they are held becomes less visible, harder to freeze, more flexible in maturity, and less dependent on any single custodian that could be targeted in a sanctions scenario.
LAYER VI - PBOC SWAP LINES: THE AMBITION TO REPLACE DOLLAR LIQUIDITY AND PRACTICAL LIMITS
6.1. China is building a parallel liquidity network The question about US Treasuries is not just: how much is China holding? The deeper question is:
Does Beijing have any tools strong enough to truly reduce its dependence on the dollar system? The most important tool is the network of bilateral currency swap agreements
of the PBOC - meaning agreements between the People's Bank of China and the central banks of other countries, allowing both parties to swap their currencies for a certain period of time. In terms of scale, this network is not small. The PBOC has about $549 billion in committed resources in swap agreements, nearly equivalent to the $565 billion in borrowed resources of the IMF as of 2020. This shows that Beijing is not just talking about reducing dependence on the dollar in theory. They are building a layer of financial safety net outside the, and
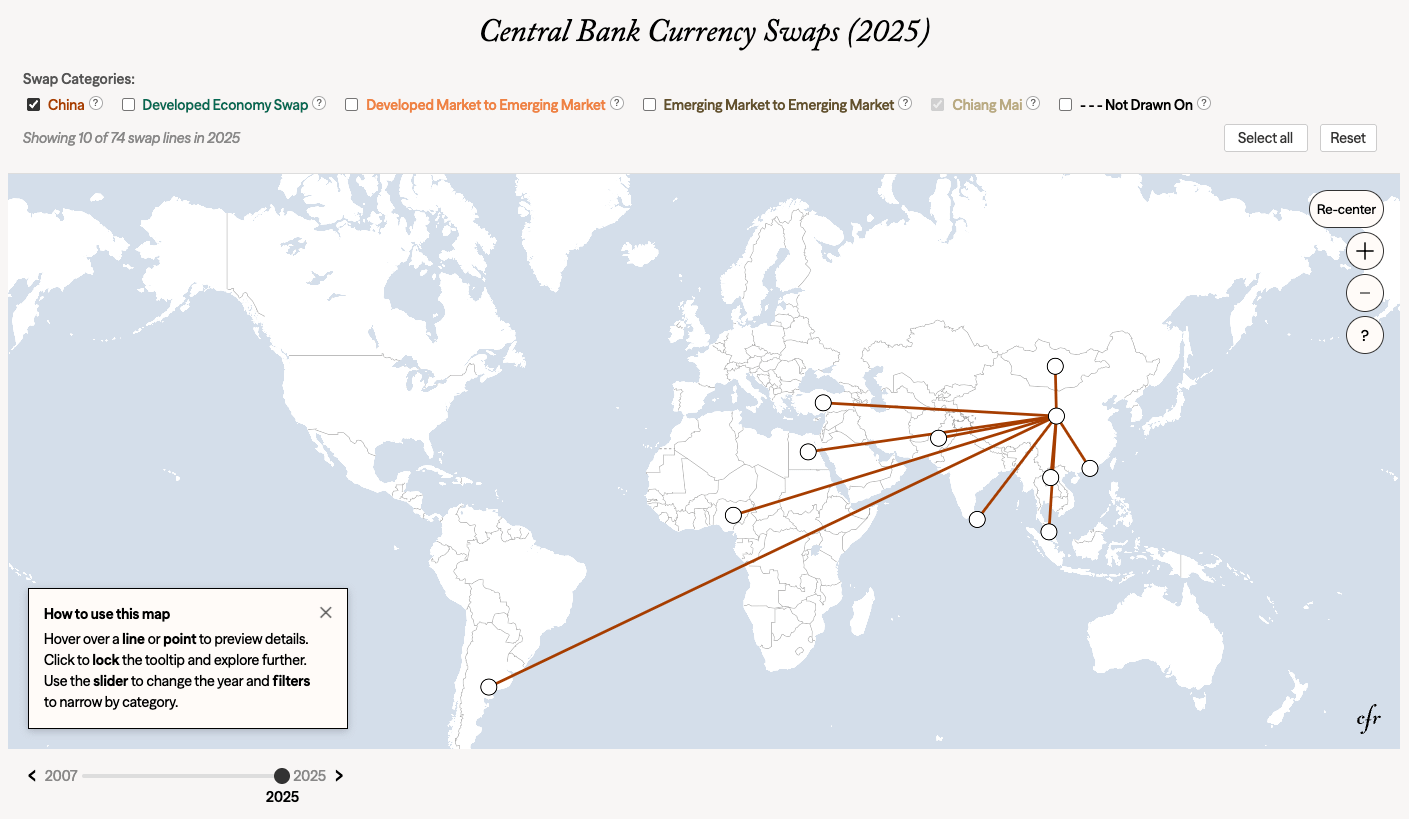
.
But scale does not equate to reliability. This is the key point. The market distinguishes very clearly between PBOC swap lines are the largest effort in that direction. In terms of scale, this network is not small. But empirical evidence shows that the market still clearly distinguishes between andPBOC swap lines . An academic study published in May 2026, using government bond yield spread data of 54 countries in the J.P. Morgan EMBIG
during the 2006-2020 period, combined with in-depth interviews and event studies around the signing of swap agreements, shows quite clear results: Fed swap lines help reduce government bond yield spreads by about30%
, with high statistical significance. PBOC swap lines
generally do not produce a significant positive impact on the recipient country's creditworthiness. During the2017-2020
, PBOC swap agreements were even correlated with higher sovereign risk. Simply put: when a country has a swap line with the Fed, the market understands it as a reliable source of liquidity insurance
that is reliable. When a country has a swap line with the PBOC, the market does not price it the same way. .The Fed provides what the market needs most in a crisis: dollar liquidity. The PBOC provides what China wants to internationalize:
. These two are not yet equivalent. Therefore, the PBOC's swap network is strategically important, but not yet sufficient to replace the Fed's role in the global financial system. China is building a parallel liquidity network - but so far, it is still not a network that the market views as equivalent to, and
.
6.2. Why the market does not yet trust PBOC swaps like Fed swaps - Three structural reasons Fed swap lines PBOC swap lines If China truly wants to reduce its dependence on the dollar system, they need more than just shifting custodians. They need an alternative liquidity system that is deep enough, reliable enough, and sufficiently accepted by the market., and
. First is the issue of currency convertibility. Most of the foreign debt of emerging economies is still denominated inUSD
. Therefore, when a country faces a liquidity crisis, what they need most is usually not RMB, but dollar liquidity. The RMB received from a PBOC swap is only useful if it can be quickly, cheaply, and reliably converted into USD. In reality, this is not always the case. Cases like Pakistan or Sri Lanka show that RMB swaps do not necessarily resolve the need for debt repayment or payments in USD. Second is the lack of transparency.
The terms of many swap agreements with China are often not fully disclosed: what the withdrawal conditions are, how much it costs, whether it can be converted to USD, and whether there are any political or commercial strings attached. When the market does not clearly understand how a backstop works, they will not price it as a real backstop. Third is the geopolitical context.
Over time, PBOC swaps are increasingly seen as part of China's RMB internationalization, Belt and Road, and financial statecraft strategies - rather than a neutral source of liquidity. This does not mean the tool is useless. But it makes the market question: is this a reliable liquidity backstop, or a conditional political agreement?
This is a direct link to the Treasuries story.
China may want to reduce its dependence on the dollar system, but its alternatives are still not strong enough to replace dollar liquidity in a crisis. If PBOC swap lines - a pillar of the renminbi internationalization strategy - fail to ease market concerns over sovereign credit risk, then de-dollarization still lacks a crucial foundation.
Herein lies the paradox:
Beijing wants to reduce its dependence on the dollar, but in a real crisis, the world still needs dollar liquidity - not RMB liquidity.
Therefore, PBOC swaps are a notable strategic tool, but not yet a complete replacement for the Fed-IMF-dollar system. China is building a parallel liquidity network, but the market still does not view it as the ultimate safe haven when financial stress occurs.
LEVEL VII - WHY CHINA CANNOT, WILL NOT, AND SHOULD NOT SELL OFF
7.1. Prisoner of the trade surplus
This is the point that most narratives about the "financial nuclear weapon" often overlook: China cannot easily sell off dollar assets, because they are trapped in their own trade surplus. With a goods surplus of over $1.2 trillion
in 2025, every surplus dollar has to go somewhere. But every option drags China back into the dollar ecosystem: Accumulating into reserves:
cash flows still return to Treasuries, Agencies, T-bills, USD deposits, or other short-term assets. Allowing the CNY to appreciate: exports lose their edge just as the domestic economy faces pressure from deflation, overcapacity, and, and
. Outbound investment:
the absorption capacity is too small compared to the surplus, and is increasingly blocked by geopolitical and investment security barriers. Holding offshore:
the USD still has not left the dollar ecosystem; it merely changes its lodging - from the PBOC to state banks, Hong Kong, Singapore, or offshore accounts. That is the fundamental paradox:
China wants to reduce its dependence on the dollar, but its surplus-driven growth model forces it to continue accumulating dollar assets.
Scale also makes any comparison with Russia flawed. China's dollar assets are many times larger than Russia's dollar assets before 2022. What Russia could do in a few years is not something China can easily replicate without hurting its own financial system and exchange rate.
7.2. The self-destructive logic of a sell-off Suppose China decides to sell$500 billion in Treasuries
. The chain reaction is not as simple as "the U.S. collapses".
First, an increase in the supply of Treasuries will drive bond prices down and yields up. But higher U.S. yields also make dollar assets more attractive, potentially strengthening the USD. At that point, China would receive a massive amount of USD from the bond sales. If it wants to convert this USD back into CNY, the buying pressure on the renminbi would drive the CNY up sharply - exactly what Beijing is trying to avoid.
In other words, a large-scale sell-off could undermine China's own exchange rate objectives.
Furthermore, if the U.S. financial market experiences severe volatility, China will not escape the damage. Beijing would face USD/CNY volatility, pressure on Chinese risky assets, capital flow reversals, falling Chinese ADRs, and tighter global credit conditions.
Therefore, Treasuries are not a one-way weapon. It is like a double-ended bomb: if detonated, the U.S. gets hurt, but China is also injured.
7.3. The dollar ecosystem is too deep to exit quickly
The final reason is the structure of the global monetary system. The dollar still accounts for about58% of global foreign exchange reserves , about54% of cross-border debt , and is involved in nearly88% of international currency transactions . Meanwhile, the renminbi still hovers around2% of global reserves
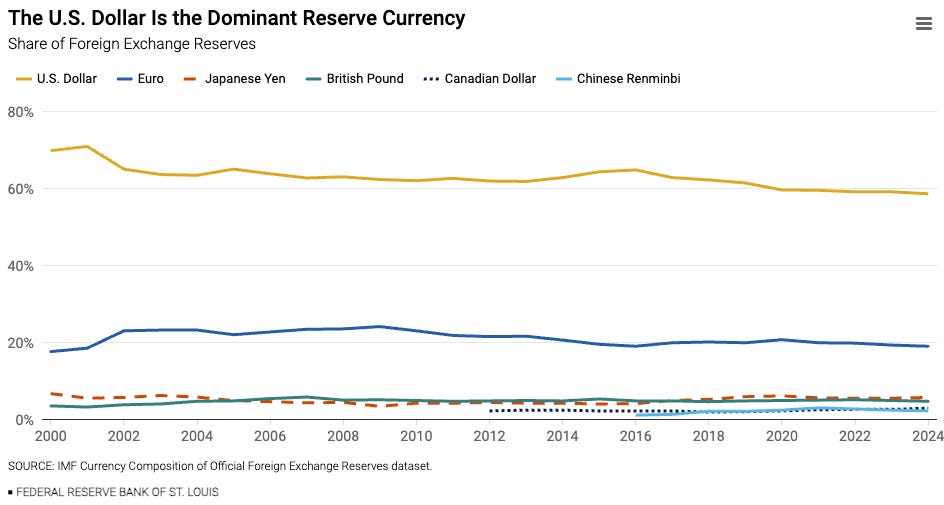
, remaining virtually flat since 2020.
This means the alternative system is not deep enough, liquid enough, or trusted enough to absorb the scale of assets that China needs to reallocate. More importantly, China is not just a dollar creditor. China is also a dollar debtor. The country has about$1.1 trillion in dollar-denominated foreign debt , while nearly 84% of its foreign currency debt is denominated in USD. The banking system alone has about $418 billion in cross-border dollar debt

Source: SAFE published China's foreign debt data as of the end of September 2023 - https://www.safe.gov.cn/en/2023/1228/2157.html
Therefore, attacking the dollar is not a cost-free strategy. China holds dollar assets, has dollar debt obligations, and needs dollars to manage its exchange rate and trade. An exit that is too rapid would shake China's own balance sheet.
The conclusion of this level is simple:
China cannot easily sell off Treasuries, does not want to let the CNY appreciate too sharply, and should not self-inflict damage on its own dollar balance sheet.
In short:
China is locked into the dollar system not because they have absolute faith in the dollar, but because their very surplus model still requires the dollar to function.
LEVEL VIII - THE REAL RISK: STRUCTURAL WITHDRAWAL AND THE ARITHMETIC PROBLEM
8.1 Distinguishing between 'selling off' and 'buying less' The key point that most market commentary overlooks is the difference between PBOC swap lines are the largest effort in that direction. In terms of scale, this network is not small. But empirical evidence shows that the market still clearly distinguishes between and, and
.
Demand for the U.S. Treasury market consists of two parts:Reinvestment demand
: buying new bonds when old bonds mature.New purchase demand
: buying additional bonds issued by the U.S. Treasury. The issue with China is not necessarily a dramatic sell-off. The issue is that they may beparticipating less in both channels
: reinvesting less in long-term bonds, and buying less of the new issuance. With a trade surplus of about$1.2 trillion per year T-billsThe greater, quieter, and more realistic risk is that China ,Agency securities non-U.S. custodians, or sitting on the balance sheets of state banks and offshore accounts, then China does not need to "sell off" to create a new void in demand for long-term Treasuries.
This is the point that the chart below illustrates quite clearly.
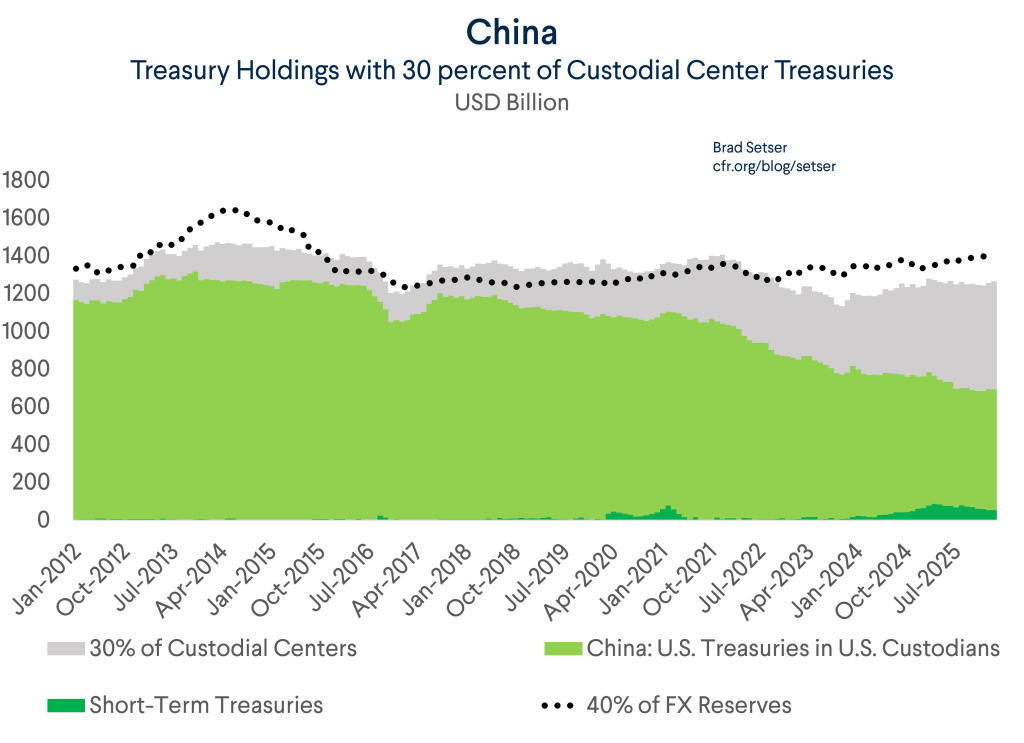
The key takeaway is: the "China" line in TIC declining does not automatically mean China is dumping Treasuries. Part of it could be a reduction in direct holdings of long-term bonds directly within the U.S. custody system; part of it could be shifting to T-bills; part of it could be shifting to non-U.S. custodians; and another part could sit on the balance sheets of state banks, and
Therefore, the real risk is not that China wakes up one day and sells all its Treasuries. The real risk is that China The greatest risk is not that China wakes up one morning and sells all of its Treasuries.The greater, quieter, and more realistic risk is that China buys less, less visible in the demand that the Treasury market has traditionally relied on, and
In other words:
Not a noisy sell-off. Rather, a quiet reduction in buying.
8.2 The arithmetic of new issuance
The real risk lies in the supply-demand dynamics of the Treasury market.
Over the next few years, the U.S. may have to issue about .. Previously, the foreign sector typically absorbed about 20–30%
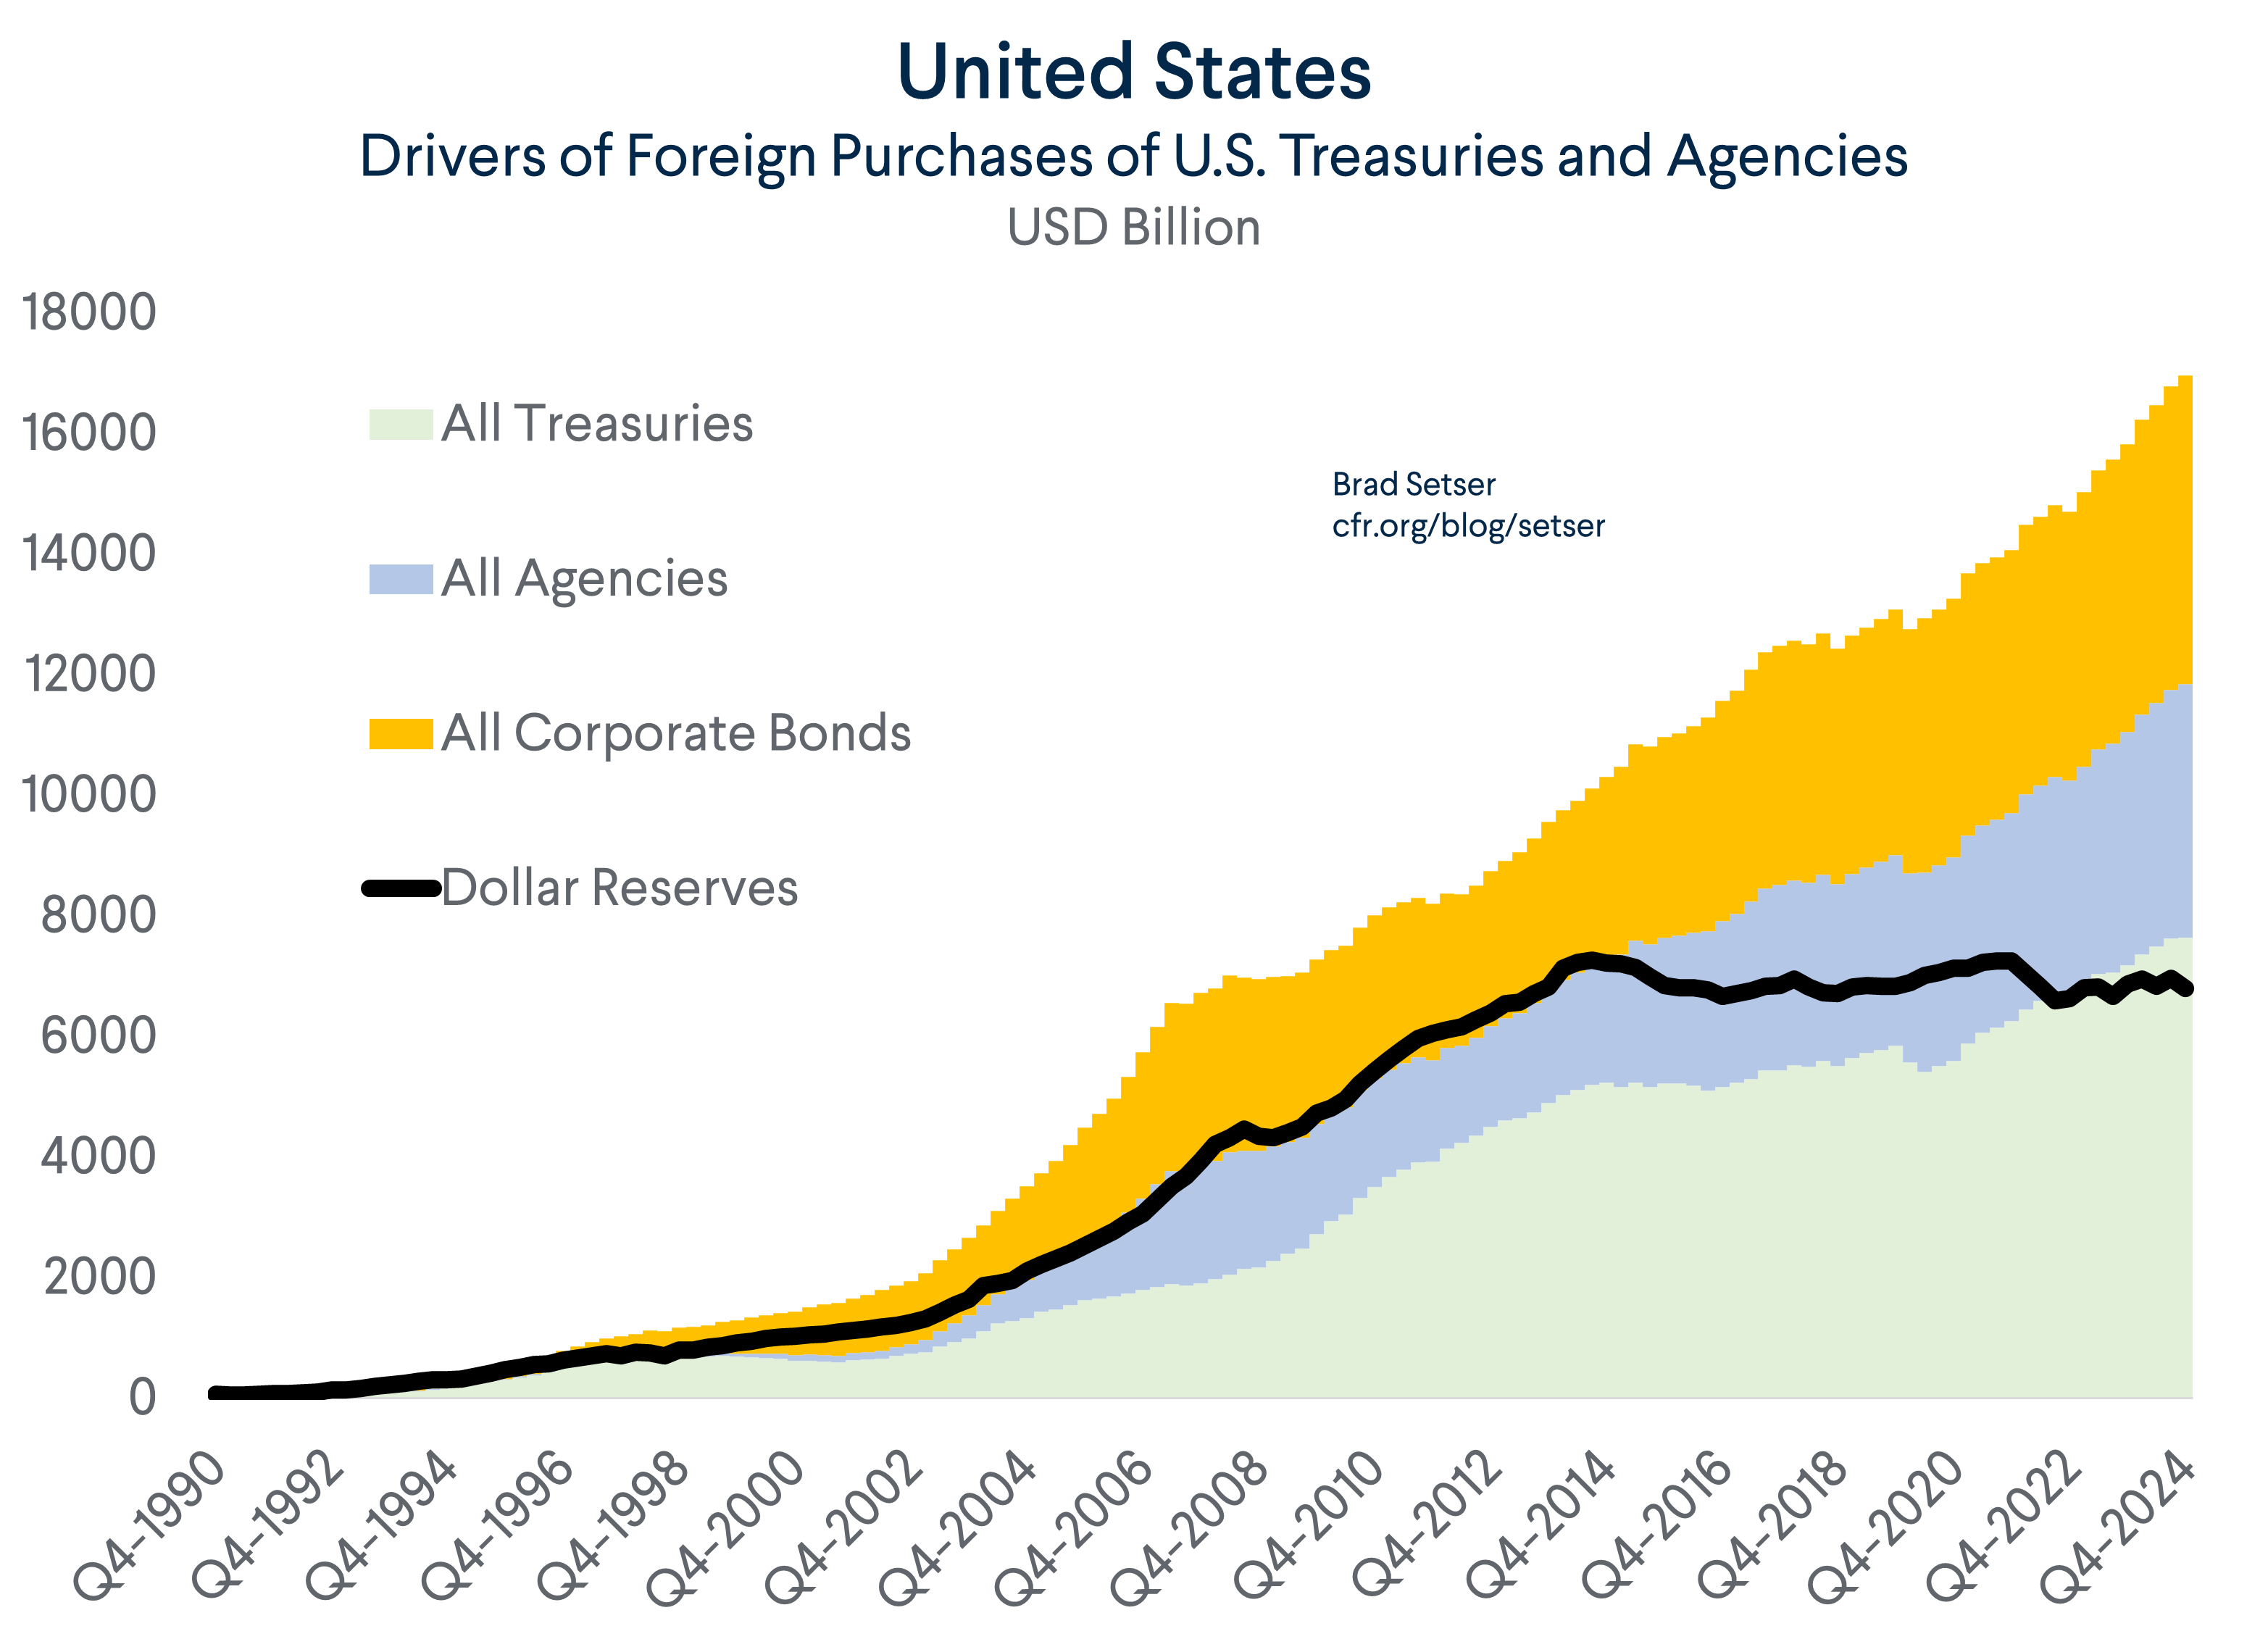
Foreign demand for U.S. debt assets remains large, but is increasingly tied to broader portfolio flows and private credit, rather than just foreign exchange reserve accumulation. This makes China's 'buying less' more notable. The risk, therefore, does not lie in a sudden sell-off. It lies in the fact thatthe structure of global Treasury buyers is changing
. The U.S. still attracts foreign capital, but those flows increasingly come from a diverse set of investors - bond funds, insurance companies, pension funds, banks, private investors - rather than relying primarily on foreign exchange reserve accumulation as before. If China reduces its purchases of new Treasuries from about $200 billion/yearto $100 billion/year , and Japan makes a similar reduction due to its own pressures from BOJ policy normalization, higher energy bills, or exchange rate pressures, the market must find an additional
$150–250 billion/year from other buyers.The greater, quieter, and more realistic risk is that China mutual fundsThe greater, quieter, and more realistic risk is that China pension funds , over the next few years. If major creditors like China and Japan gradually reduce their role in absorbing new issuance, the shortfall must be shifted to other investors: bond funds, pension funds, insurance companies, banks, or domestic U.S. investors. or U.S. domestic investors demand higher yields to absorb the additional issuance,
term premium
could rise, and long-term U.S. interest rates could face upward pressure even if the Fed does not change short-term rates.
This is the real transmission channel from the behavior of large foreign holders to U.S. borrowing costs.
No noise.
Not a financial nuclear weapon.
Not necessarily a geopolitical shock.
Just the simple arithmetic of supply and demand:
If the old marginal buyers buy less, new buyers will demand a better price - meaning higher yields. 8.3 Correctly interpreting the 2025-2026 TIC series, and
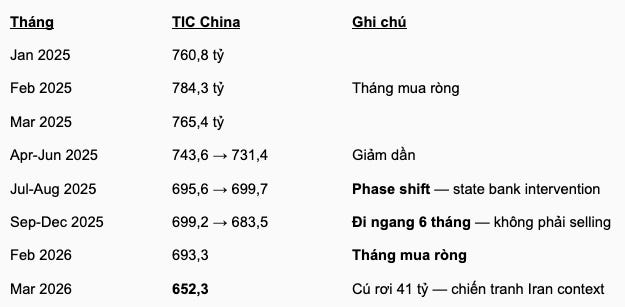
asset rerouting, passive maintenance, and then liquidity-driven selling during periods of stress . Pattern 1 - Shift in 07-08/2025:holdings of China, Mainland fell from $731.4 billion to $695.6 billion, or about -$35.8 billion. This is a significant decline, but it should not be simply read as a 'sell-off'. In the context of state banks absorbing more USD and assets potentially being held through non-U.S. custodians, part of this volatility may reflect
a shift in custody location or holding maturity , not just asset sales. Pattern 2 - Flat 06-09/2025:from September to December 2025, holdings fell from $699.7 billion to $683.5 billion, or about -$16.2 billion over four months. This is a moderate decline relative to the portfolio size, more consistent with
passive maintenance / portfolio rebalancing , rather than a systematic exit from Treasuries.
Pattern 3 - Net buying month in 01/2026: from December 2025 to January 2026, holdings rose from $683.5 billion to $694.4 billion, or +$10.9 billion. This is a key point because it refutes the narrative that China is selling steadily, continuously, and intentionally every month.
Pattern 4 - 02/2026 almost flat: February 2026 fell very slightly from $694.4 billion to $693.3 billion, or -$1.1 billion. If there were a systematic dumping campaign, we would expect a steadier and sharper decline. But the January-February data does not show that.Pattern 5 - The drop in 03/2026: March 2026 fell from $693.3 billion to $652.3 billion, or -$41.0 billion. This is the largest decline in the recent series. Reuters also noted that March 2026 was the month Japan and China led the decline in foreign holdings of Treasuries, while total foreign holdings fell from February's record high. This is more consistent with a sale driven by liquidity pressure (
liquidity-driven selling)
during a period of market stress, rather than evidence of a linear and prolonged sell-off strategy.
The conclusion of this series is: TIC data does not show a straight line of 'China dumping Treasuries'. It shows a more complex picture: sharp declines in some months, sideways movement in others, net buying in some, and a large drop during a period of stress.Therefore, the correct interpretation is not
systematic dumping
The data shows a more complex picture: some months see sharp declines, some periods are almost flat, some months show net buying, and there are major drops during periods of market stress.
portfolio rebalancing + custody shifting + liquidity management.
portfolio rebalancing + custody shifting + liquidity management
CONCLUSION: FIVE THINGS THAT ARE ACTUALLY HAPPENING
China is doing something more subtle: restructuring how they hold USD assets to make them less visible, more flexible in maturity, more diversified in custody locations, and less dependent on the U.S. custody system. The figure $652 billion, and
Treasuries directly recorded under the name China, Mainland in TIC ., and
$750–850 billion . But if expanded to the entirety of $652 billion, and
$1,350–1,850 billion . If we go even further, including CIC, state banks, SAFE vehicles, and the Hong Kong Exchange Fund within a broader $1,350-1,850 billion, and
$2,000 billion
.
Therefore, the question is not:
Does China still hold $652 billion or $2,000 billion?
The more accurate question is:
Which scope are we measuring - direct Treasuries, reserve-related assets, or the entire state-linked financial ecosystem tied to the USD?
Without separating these three scopes, any debate about 'China dumping Treasuries' can easily become a discussion with the wrong denominator. Point 2 - This is a shift in custody, not an abandonment of the dollar PBOC swap lines are the largest effort in that direction. In terms of scale, this network is not small. But empirical evidence shows that the market still clearly distinguishes between currency exposure, and
custody exposure .
Currency exposure is the question: how much does China still rely on USD-denominated assets?
Custody exposure is the question: how much of that is held in locations where the U.S. can directly observe through the TIC system?What is declining most visibly is not necessarily
USD assets
, but rather the portion of USD assets held in easily observable U.S. custody channels. Assets can move from New York to Brussels, Luxembourg, Paris, London, Toronto, or Hong Kong. They can shift from long-term Treasuries to T-bills, Agencies, deposits, or the balance sheets of state banks.
On a headline level, this looks like:
China is pulling out of U.S. assets.
But structurally, it looks more like: China is making its USD assets more diversified, shorter-term, harder to freeze, and more difficult to track directly. This is not de-dollarization, and
de-visible-dollarization
.
Point 3 - China's alternatives are still not reliable enough If China truly wants to reduce its dependence on the dollar system, they need more than just shifting custodians. They need an alternative liquidity system that is deep enough, reliable enough, and sufficiently accepted by the market. PBOC swap lines are the largest effort in that direction. In terms of scale, this network is not small. But empirical evidence shows that the market still clearly distinguishes between Fed swap lines, and
PBOC swap lines .The Fed provides what the market needs most in a crisis: dollar liquidity. The PBOC provides what China wants to internationalize:
yuan liquidity
. These two are not yet equivalent.
The problem lies in three areas: the uncertain convertibility of RMB to USD, the lack of transparency in swap terms, and the fact that PBOC swaps are often tied to strategic goals rather than serving as a neutral backstop.
Thus, the paradox of de-dollarization lies here:
Beijing wants to reduce its dependence on the dollar, but in a real crisis, the world still needs dollar liquidity - not yuan liquidity.
Point 4 - 'Sell-off' is an oversimplified description
The 2025-2026 TIC series does not show a straight line of 'China is dumping Treasuries'. The data shows a more complex picture: some months see sharp declines, some periods are almost flat, some months show net buying, and there are major drops during periods of market stress., and
portfolio restructuring + shifting custody locations + liquidity management . China may be reducing its holdings of
long-term Treasuries
directly in U.S. custodians. But that does not mean they are leaving the USD ecosystem. A portion may be shifting to T-bills. A portion may be in Agencies. A portion may go through foreign custodians. Another portion may be absorbed by state banks or offshore accounts.
In short:
China is not necessarily dumping all of its U.S. assets. They are restructuring how they hold USD assets.
Point 5 - The real risk is not a sudden dump, but a silent retreat from the role of marginal buyer The greatest risk is not that China wakes up one morning and sells all of its Treasuries.The greater, quieter, and more realistic risk is that China buys less, reinvests less in long-term maturities, and
becomes less present in the demand pool that the Treasury market has traditionally relied on . The U.S. still has to issue about
$1.5-2.0 trillion in new Treasuries each year over the next few years. If major creditors like China and Japan gradually reduce their role in absorbing new issuance, the shortfall must be shifted to other investors: bond funds, pension funds, insurance companies, banks, or domestic U.S. investors. These buyers are typically more yield-sensitive. They will demand a higher risk premium to absorb more duration. Consequently,
term premium
could rise, and long-term U.S. interest rates could face upward pressure even if the Fed does not change short-term rates.
This is the real transmission channel from the behavior of foreign holders to U.S. borrowing costs.
No noise.
Not a financial nuclear weapon.
Not necessarily a geopolitical shock.
Just the arithmetic of supply and demand:
If the old marginal buyer buys less, new buyers will demand higher yields.
The shortest answer
China is not dumping Treasuries. China has not truly abandoned the dollar either.
China is doing something more subtle: restructuring how they hold USD assets to make them less visible, more flexible in maturity, more diversified in custody locations, and less dependent on the U.S. custody system. The figure of $652 billion is only the portion of Treasuries directly visible in TIC. The broader picture shows that China remains deeply tied to USD assets - likely around $1,350-1,850 billion within the scope of official/reserve-related U.S. holdings, and over
$2,000 billion
if counting the entire state-linked dollar exposure.
Therefore, the correct headline is not:
China is dumping Treasuries and abandoning the dollar.
A more accurate headline is: China remains within the dollar system, but is learning to navigate it through less visible pipelines.