“The factory of the world is now competing with the world’s factories - and winning in ways that were never supposed to be possible.”
“The world's factory is now not only producing for the world but is competing directly with the world's factories - and winning in ways that were previously thought impossible.”
- Michael Pettis, Carnegie Endowment for International Peace
Some economic stories unfold so slowly that people fail to realize they are reshaping the world order - until goods appear on their own streets, carrying absurdly low prices, surprisingly high quality, and a difficult question: is this driven by true market forces, or by a system where conventional market rules no longer apply?
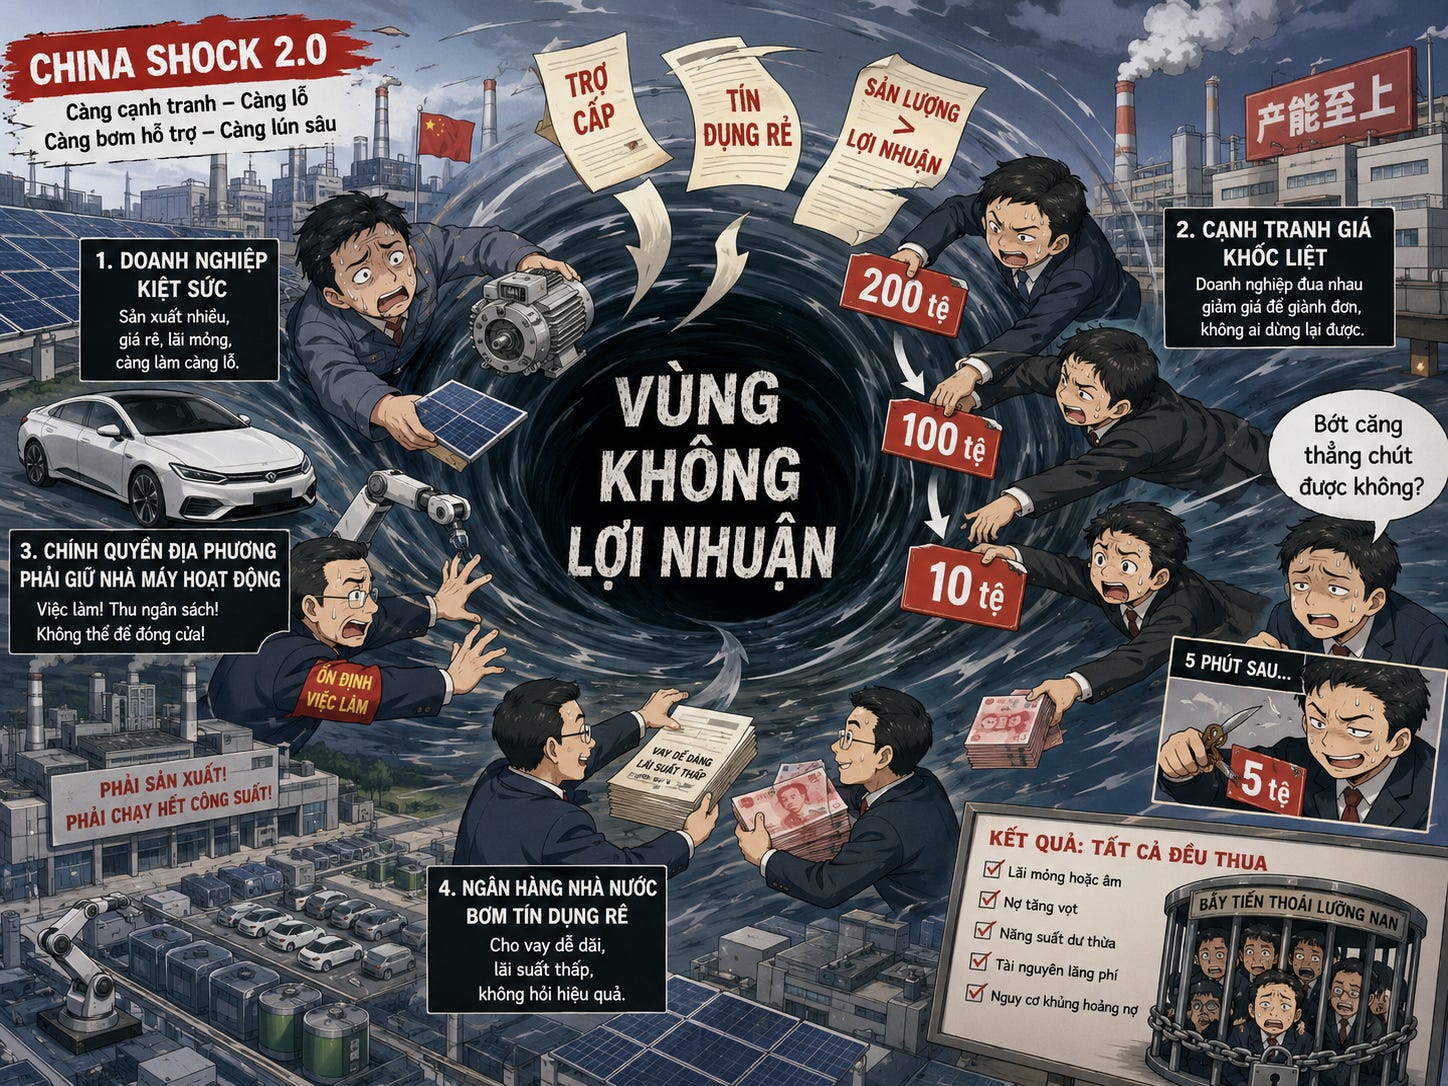
They begin much more quietly: a Chinese SUV appears on the streets of London at a lower-than-expected price. A solar panel so cheap that European manufacturers cannot fathom where their rivals are making a profit. An EV sensor that once sold for 200 yuan, now squeezed down to 10 yuan. A container leaves the ports of Shanghai, Ningbo, or Shenzhen - carrying no weapons, but something with a more silent destructive power: overcapacityThis advantage is most evident in metal refining. China holds a very high share of many strategic materials such as
That is China Shock 2.0.
China Shock 1.0, following China's accession to the WTO, was a story of cheap labor, low-cost consumer goods, toys, textiles, furniture, and electronics assembly. That shock redrew the global industrial map, but the West still had a comfort zone to reassure itself: they could lose the bottom of the value chain as long as they held the higher ground - automobiles, machinery, chemicals, industrial equipment, and green technology.
China Shock 2.0 strikes directly at that very comfort zone.
This time, China is not just exporting t-shirts, toys, or assembled phones. China is exporting EVs, batteries, solar panels, robots, sensors, industrial equipment, refined materials, and all the input layers underlying the green economy. This is no longer a story of a country selling cheaper goods. This is the story of a massive industrial ecosystem - fueled by cheap electricity, cheap credit, multi-tiered subsidies, favorable exchange rates, large-scale metallurgy, and state industrial policy - colliding with the rest of the world.
And the pace of change is far exceeding market expectations.
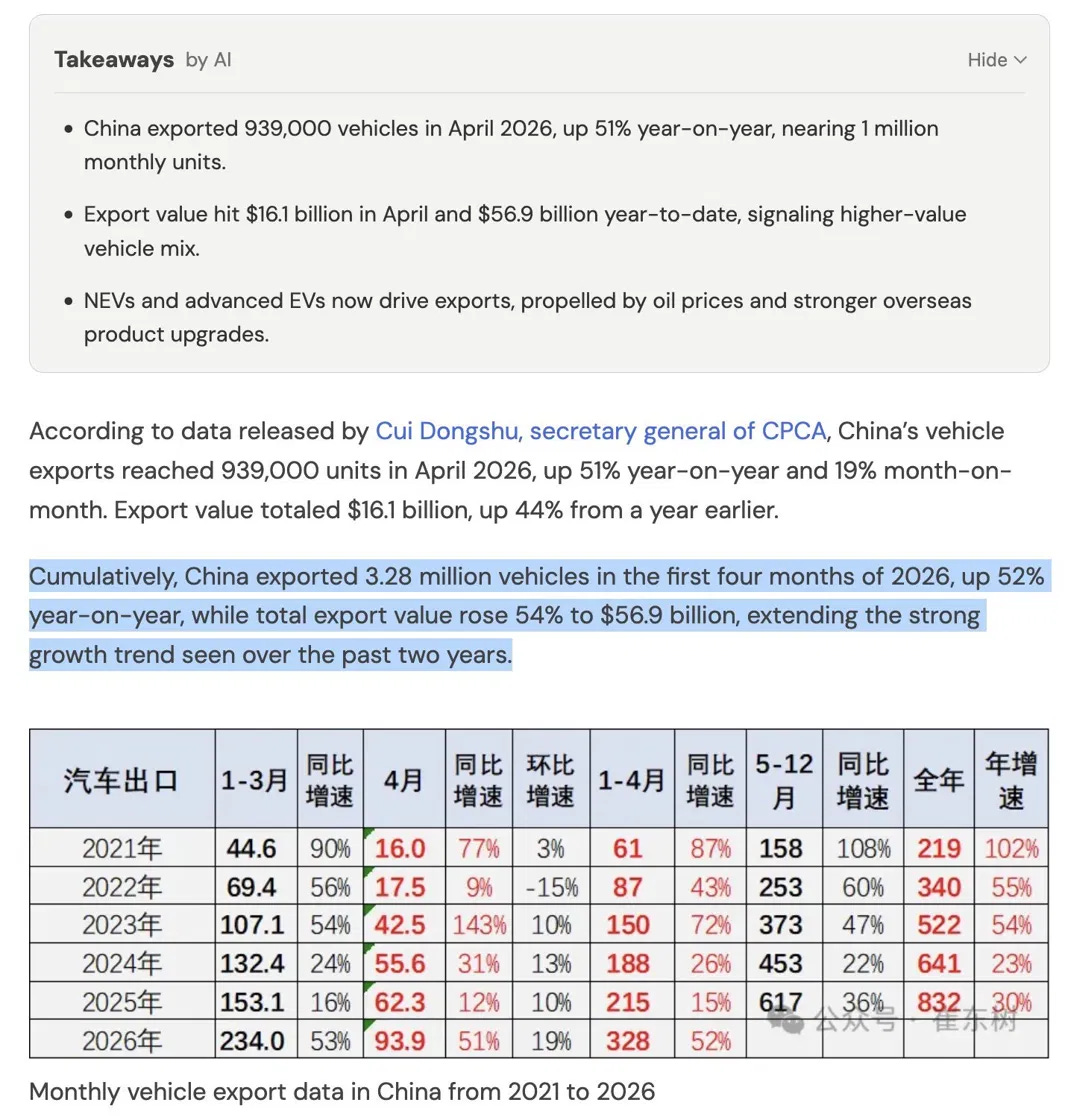
In March 2026, China's Jaecoo 7 SUV - with a starting price of approximately £29,000 - became the best-selling car in the UK. By April 2026, China exported In April 2026, China exported in a single month, up , up 51% year-on-year. In the first four months of the year, total vehicle exports reached, with a value of year-on-year. Export value reached. If this pace continues, China could export more than 10 million vehicles in the full year 2026.
To put the scale of the shock into perspective: Germany - Europe's historic automotive powerhouse - net exported about 1.5 million vehicles in 2025. China could exceed that figure by 6–7 times in just one year.
Not with warships. Not with missiles. Not with diplomatic pressure.
Only with cars, batteries, solar panels, robots, and the supply chains that the rest of the world still relies on.
But if we only view China Shock 2.0 as an export offensive from Beijing, we miss the most important paradox: those operating the machine are also being crushed by itThis advantage is most evident in metal refining. China holds a very high share of many strategic materials such as
Chinese enterprises do not always win. Many companies are selling more but earning less. Output is rising, prices are falling, and profit margins are being eroded. Founders who once dreamed of technological innovation are now dragged into an inescapable price war. Local governments want to keep factories open to protect GDP, VAT, and jobs. Banks continue to extend credit to avoid a wave of bankruptcies. And Beijing, despite understanding the problem of neijuan - the race-to-the-bottom competitive spiral - still cannot easily stop the machine it has built.
This is what makes China Shock 2.0 different from a typical trade war.
In a classic market economy, oversupply self-corrects: prices fall, weak firms exit the market, capacity is cut, and a new equilibrium forms. But in China, that feedback loop is distorted by a much more complex system:
VAT is tied to the place of production, giving local authorities an incentive to keep factories running;
cheap credit from state-owned banks extends the life of weak enterprises;
multi-tiered subsidies prevent excess capacity from being quickly shut down;
exchange rates and domestic deflation make exports cheaper in real terms;
cheap electricity, metallurgy, and refined materials create supply chain advantages deeper than the final product.
The result is a strange machine: the more the overcapacity, the more they must produce; the more the losses, the more they need to export; the stronger the exports, the more the world builds protectionist walls; and the more they are blocked, the greater the internal pressure of overcapacity within China becomes.
EVs are only the most visible front. Behind them lies a larger structure: China is not just manufacturing final products, but controlling multiple layers of materials beneath them - from batteries, graphite, rare earths, gallium, silicon, cathode materials, and permanent magnets to machinery and intermediate components.
This is why 'diversifying away from China' sounds much simpler than it actually is. A company can move an assembly plant to Mexico, Vietnam, or Eastern Europe. But if the backbone of the supply chain still comes from China, the world is only moving the surface - while the foundation remains within the Chinese ecosystem.
This week's question, therefore, is not just: “Are Chinese cars too cheap?”
The bigger question is:
Why can't this overcapacity machine stop itself? What keeps it running even when profits vanish? And as that machine crashes into the geopolitical walls being built from Washington and Brussels to New Delhi - what will happen to global trade for the remainder of this decade?
This week's article will cover five parts:
Part I - Neijuan: Anatomy of the overcapacity machine and why it cannot stop itself.
Part II - Real Data, Real Paradoxes: Correctly reading the Chinese EV landscape.
Part III - Batteries, the Electro-state, and the Weaponization of Supply Chains: Why China's advantage lies deeper than the final product.
Part IV - The World's Response: The new map of a bloodless war.
Part V - Three Scenarios for the Rest of the Decade: From prolonged overcapacity and restructured competition to the risk of disruption.
Viet Hustler is a reader-supported publication. To receive new posts and support my work, consider becoming a free or paid subscriber.
PART I - NEIJUAN: ANATOMY OF THE OVERCAPACITY MACHINE AND WHY IT CANNOT STOP ITSELF
1.1. The Story of Mega-Senway - and the Bigger Picture Behind It
Let's start with a small story, because sometimes the best way to understand a massive economic force is to look at a very specific business.
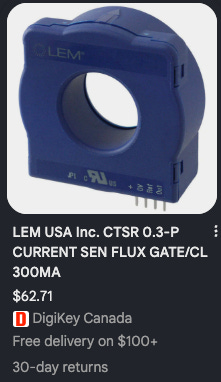
In 2019, Huang Xian founded Mega-Senway Electronic Technology in Shanghai. His product was a current leakage detection sensor for EV chargers, about the size of a fist. At the time, the market was dominated by German and Swiss companies, with prices around 200 yuan, or approximately $30, per unit.
I found a similar product in Canada for $62 CAD, approximately $45 USD
Mega-Senway produced at a cost of 40 yuan and sold for 100 yuan - a beautiful business model: low costs, competitive pricing, and attractive profit margins.
Mega-Senway's production line
By 2026, they were selling the same product for 10 yuan. Expected output reached 10 million units. Gross margins on many orders are trending toward zero.
This is not necessarily a failure. It is a success - but measured by the wrong set of criteria.
Mega-Senway did everything a modern industrial enterprise is encouraged to do: rapid market entry, radical cost-cutting, automation, and scaling up. But in the process, they were sucked into the spiral that China calls neijuan - involution, or the race-to-the-bottom competitive spiral.
“Before, you could just focus on making the product. Now everyone is in a daze, wondering what is actually happening and why we are being sucked into this downward spiral,” Huang said.
The Mega-Senway story is a template for the entire modern Chinese economy: from electronic sensors to EV batteries, from solar panels to industrial robots, from cars to telecommunications equipment. Everywhere, the pattern is the same: rising volumes, falling prices, and profit margins trending toward zero or negative - yet the machine keeps running.
1.2. Four Forces Keeping the Machine Running Despite Lack of Profit
In a normal market economy, the feedback loop operates quite clearly:
In China, that feedback loop is broken at four points.
The first driver: VAT structure and local government incentives.
This is a point often overlooked by Western analyses, despite being close to the root of the problem.
VAT generates nearly 40% of China's tax revenue. The central government shares this revenue with the locality where goods are produced - not where they are consumed. This means every operating factory generates revenue for the province, regardless of whether it is profitable.
At the same time, local officials are still evaluated primarily on GDP growth, investment, and employment stability - not the actual economic efficiency of the businesses in their jurisdiction. Consequently, local governments have a massive incentive to keep factories open, but very little incentive to let the market self-correct when production capacity exceeds demand.
“Officials fear missing GDP targets. No one fears oversupply. As long as you are producing, there is VAT. Whether you can sell it or make a profit - that doesn't really affect them,” an anonymous entrepreneur told the FT.
The second driver: multi-layered subsidies and low-interest credit.
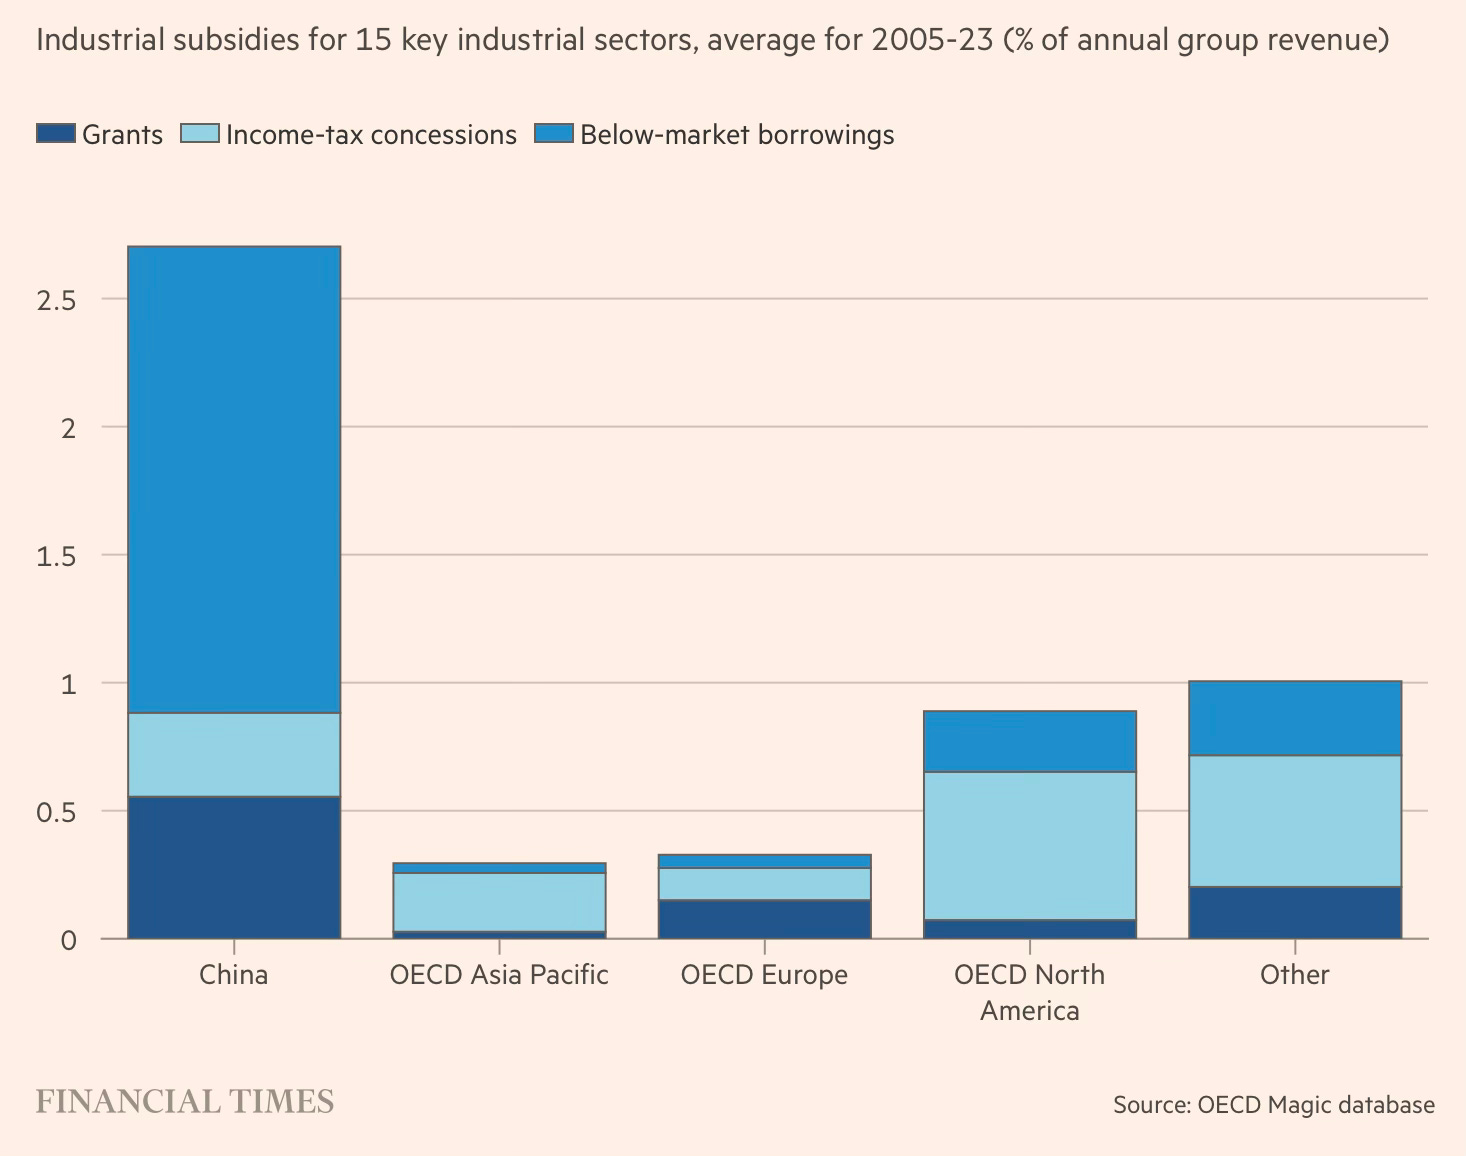
OECD analysis shows that Chinese enterprises in key industries are subsidized at much higher levels than their rivals in developed economies - approximately 3–9 timesThis advantage is most evident in metal refining. China holds a very high share of many strategic materials such as
But the most important point lies not just in cash subsidies or tax incentives. It lies at a deeper level: cheap credit from the state banking system. Simply put: Chinese companies can endure losses much longer than many foreign competitors because they are not punished by capital markets in the usual way.
Looking at the chart, China stands out as an outlier. Total industrial support is significantly higher than in OECD Asia Pacific, OECD Europe, OECD North America, and the 'Other' group. Notably, most of the difference comes from below-market borrowings - loans at below-market interest rates.
This distorts the market's cleansing mechanism:
businesses can sustain losses longer;
excess capacity is not shut down quickly;
factories continue to operate even as profit margins approach zero;
price wars can last beyond the endurance of foreign competitors.
In other words, China Shock 2.0 is not just funded by the state budget. It is also funded by the balance sheets of the state financial systemThis advantage is most evident in metal refining. China holds a very high share of many strategic materials such as
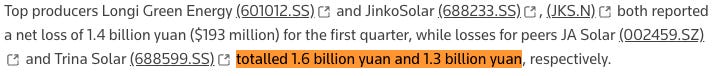
The solar industry is the most extreme example. The top six listed companies are projected to have cumulative losses of 43 billion yuan in 2025. Jinko Solar received 1.3 billion yuan in subsidies in the first half of 2025 - but still lost 3 billion yuan during the same period. Nevertheless, the solar production machine continues to run.
Source: Reuters
This is why Chinese companies can go further in price wars: for many Western firms, prolonged losses are punished by capital markets; for many Chinese enterprises, losses can be sustained through cheap credit, local funds, and a policy system that views production capacity as a strategic asset.
The third driver: an undervalued exchange rate and relative negative inflation.
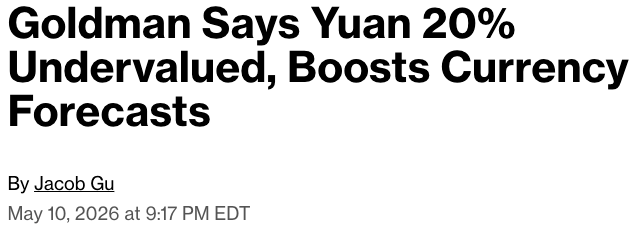
According to some estimates, Goldman Sachs believes the yuan is undervalued by about 20%, while the IMF estimates around 16% on a real effective exchange rate basis. While specific figures are debated, the direction of the impact is clear: a weaker currency makes Chinese exports cheaper on international markets.
Goldman Sachs estimates the RMB is undervalued by 20% against the USD; the FT cites IMF estimates that China's REER is undervalued by about 16%This advantage is most evident in metal refining. China holds a very high share of many strategic materials such as
More importantly, lower inflation in China compared to many trading partners makes Chinese exports increasingly cheaper in real terms for buyers in Europe, even if nominal exchange rates do not change much.
This is a form of 'implicit tariff' on competitors - it doesn't go through official tariff schedules, yet it still shifts price relativities in the global market.
The fourth driver: 'migratory bird enterprises' and the endless subsidy loop.
Competition between provinces to attract investment has created a strange phenomenon: many businesses move from one province to another to take advantage of better subsidy packages, then move again when the subsidies run out. They are called 'migratory bird enterprises.'
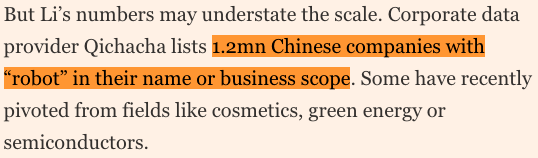
In the industrial robotics sector - with over 1.2 million companies having 'robot' in their name or business scope - a founder in Western China listed the benefits his company receives: subsidies for customers to buy his robots, factory expansion subsidies, support for rooftop solar panels, funding for energy storage systems, and a 'smart factory' plaque from the provincial government that comes with additional incentives.
“My competitors receive those same benefits. That may have contributed to the wave of new rivals that forced my prices down 10% over the past year. At the same time, we wouldn't be here without them.”
The market does not clear because the state continuously pumps oxygen into businesses that should have exited the game.
1.3. The trilemma with no clean exit
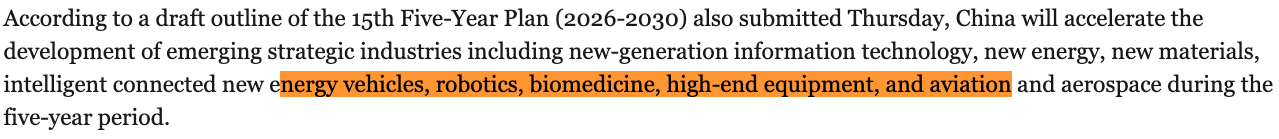
Beijing knows that neijuan is a problem. But that doesn't mean they will withdraw the state from industrial policy. On the contrary, the Five-Year Plan 2026–2030 continues to place technological innovation and industrial upgrading at the center, with priority sectors ranging from biomanufacturing/biomedicine, new materials, robotics, high-end equipment, new energy to aerospaceThis advantage is most evident in metal refining. China holds a very high share of many strategic materials such as
Source: Chinese Government Website
In other words, Beijing wants to reduce predatory competition but does not want to abandon the model of using the state to direct strategic production capacity.
The first path - capacity reduction. This is the economically rational choice, but a politically dangerous one. Cutting capacity means mass unemployment, social instability, and political risk. The automotive industry alone accounts for about one-tenth of China's GDP. The consequences of a sharp correction are something Beijing finds very difficult to accept while growth is slowing.
The second path - maintaining the status quo. This is the easiest choice in the short term, but the costliest in the long run. It means continuing to pump money into sustaining zombie companies, accumulating bad debt in the banking system, and prolonging domestic deflationary pressure. The cost doesn't disappear; it is merely pushed into the future.
The third path - boosting exports. This is the natural release valve for the overcapacity model. But the problem is that external markets are closing faster than China can open them. The EU, US, India, Brazil - every month another market puts up walls. And every closed market funnels more export pressure into the remaining ones.
“Analysts often confuse the global competitiveness of Chinese manufacturing with production efficiency. China's competitiveness depends on an undervalued exchange rate, very cheap credit, and very low wages relative to productivity.”
That is the central paradox of China Shock 2.0: China can win in global markets not just because it produces more efficiently, but because its system can endure levels of inefficiency that normal market economies cannot withstand.
1.4. Why is China Shock 2.0 different from China Shock 1.0?
Before diving into electric vehicles, a fundamental point must be understood: China Shock 2.0 is not a copy of China Shock 1.0. It is more dangerous because it targets the very industries that the West once considered 'safe zones'.
China Shock 1.0, following China's WTO accession, was primarily a shock of cheap labor:
textiles;
toys;
furniture;
consumer goods;
electronics assembly;
labor-intensive industries.
At that time, the West still had a self-reassuring argument: losing low-end industries was acceptable, as long as they held onto the higher parts of the value chain - automobiles, machinery, chemicals, industrial equipment, green techThis advantage is most evident in metal refining. China holds a very high share of many strategic materials such as
But China Shock 2.0 strikes directly at that very segment.
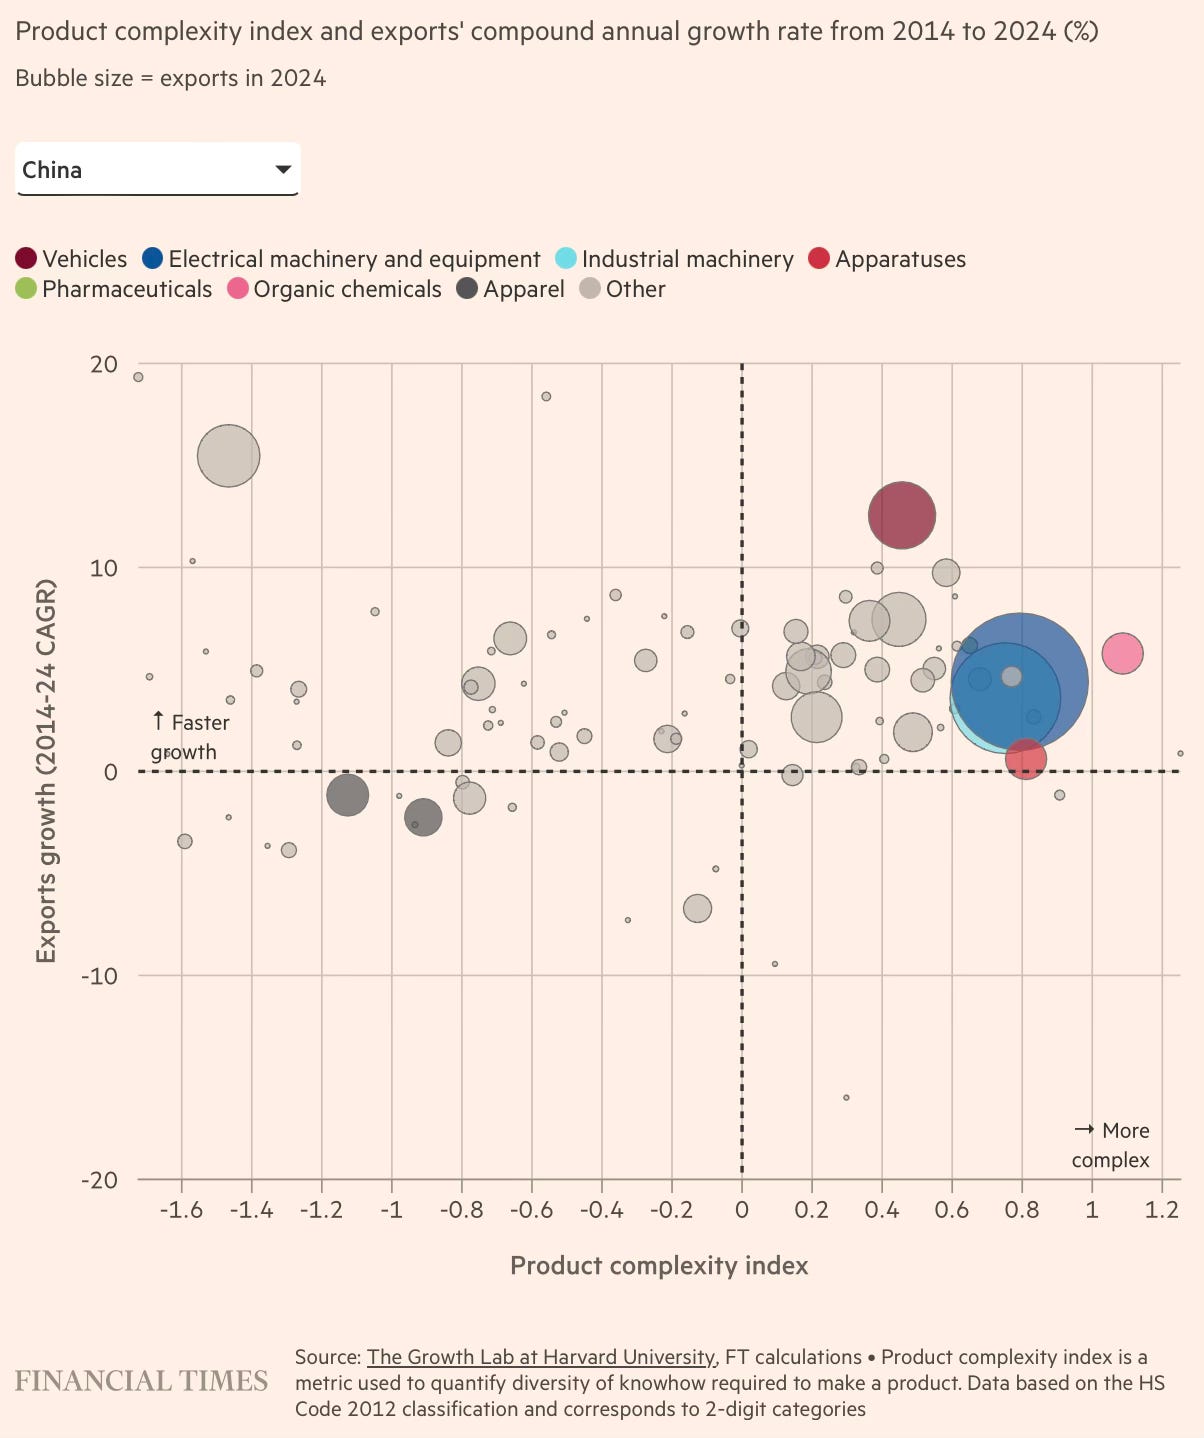
Chart: Product complexity and China's export growth rate, 2014–2024 - Bubble size corresponds to 2024 export value
This chart shows that China is not only exporting more, but also exporting more complex goods. Vehicles, electrical machinery, industrial machinery, and chemicals are all in the high-complexity zone, yet continue to grow rapidly.
The frightening point is: China is not abandoning low-end manufacturing. They are retaining it while simultaneously climbing to higher industrial tiers. In other words, China is not just competing with the bottom of the world - it is competing with the world's industrial core.
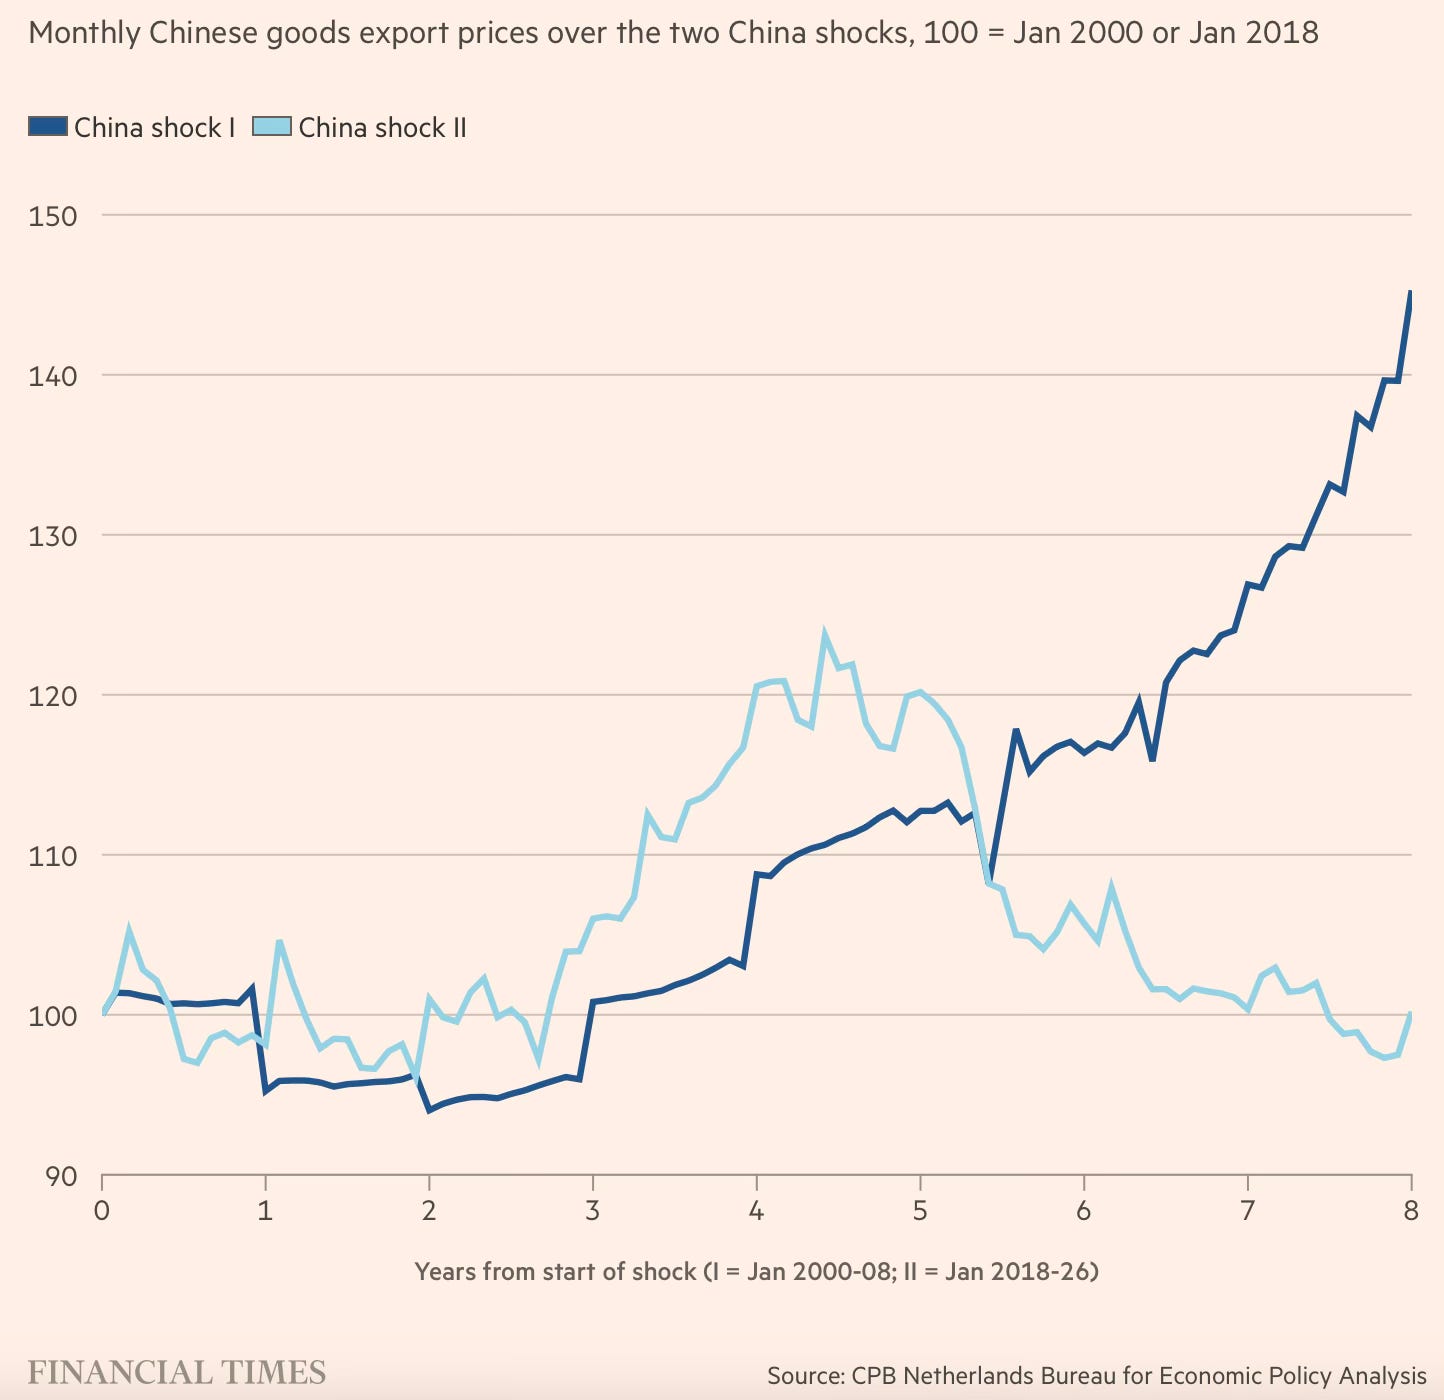
Chart: Chinese export prices during the two China Shocks Index 100 = January 2000 or January 2018
The second difference lies in price.
In China Shock 1.0, Chinese export prices rose significantly over time. But in China Shock 2.0, export prices have remained almost flat compared to 2018 levels.
This creates a troubling paradox for the rest of the world:
Chinese products are more sophisticated;
higher technological content;
better quality;
yet prices have not increased accordingly.
In short: the world is receiving "higher-end" Chinese goods, but still under the price pressure of low-cost products.
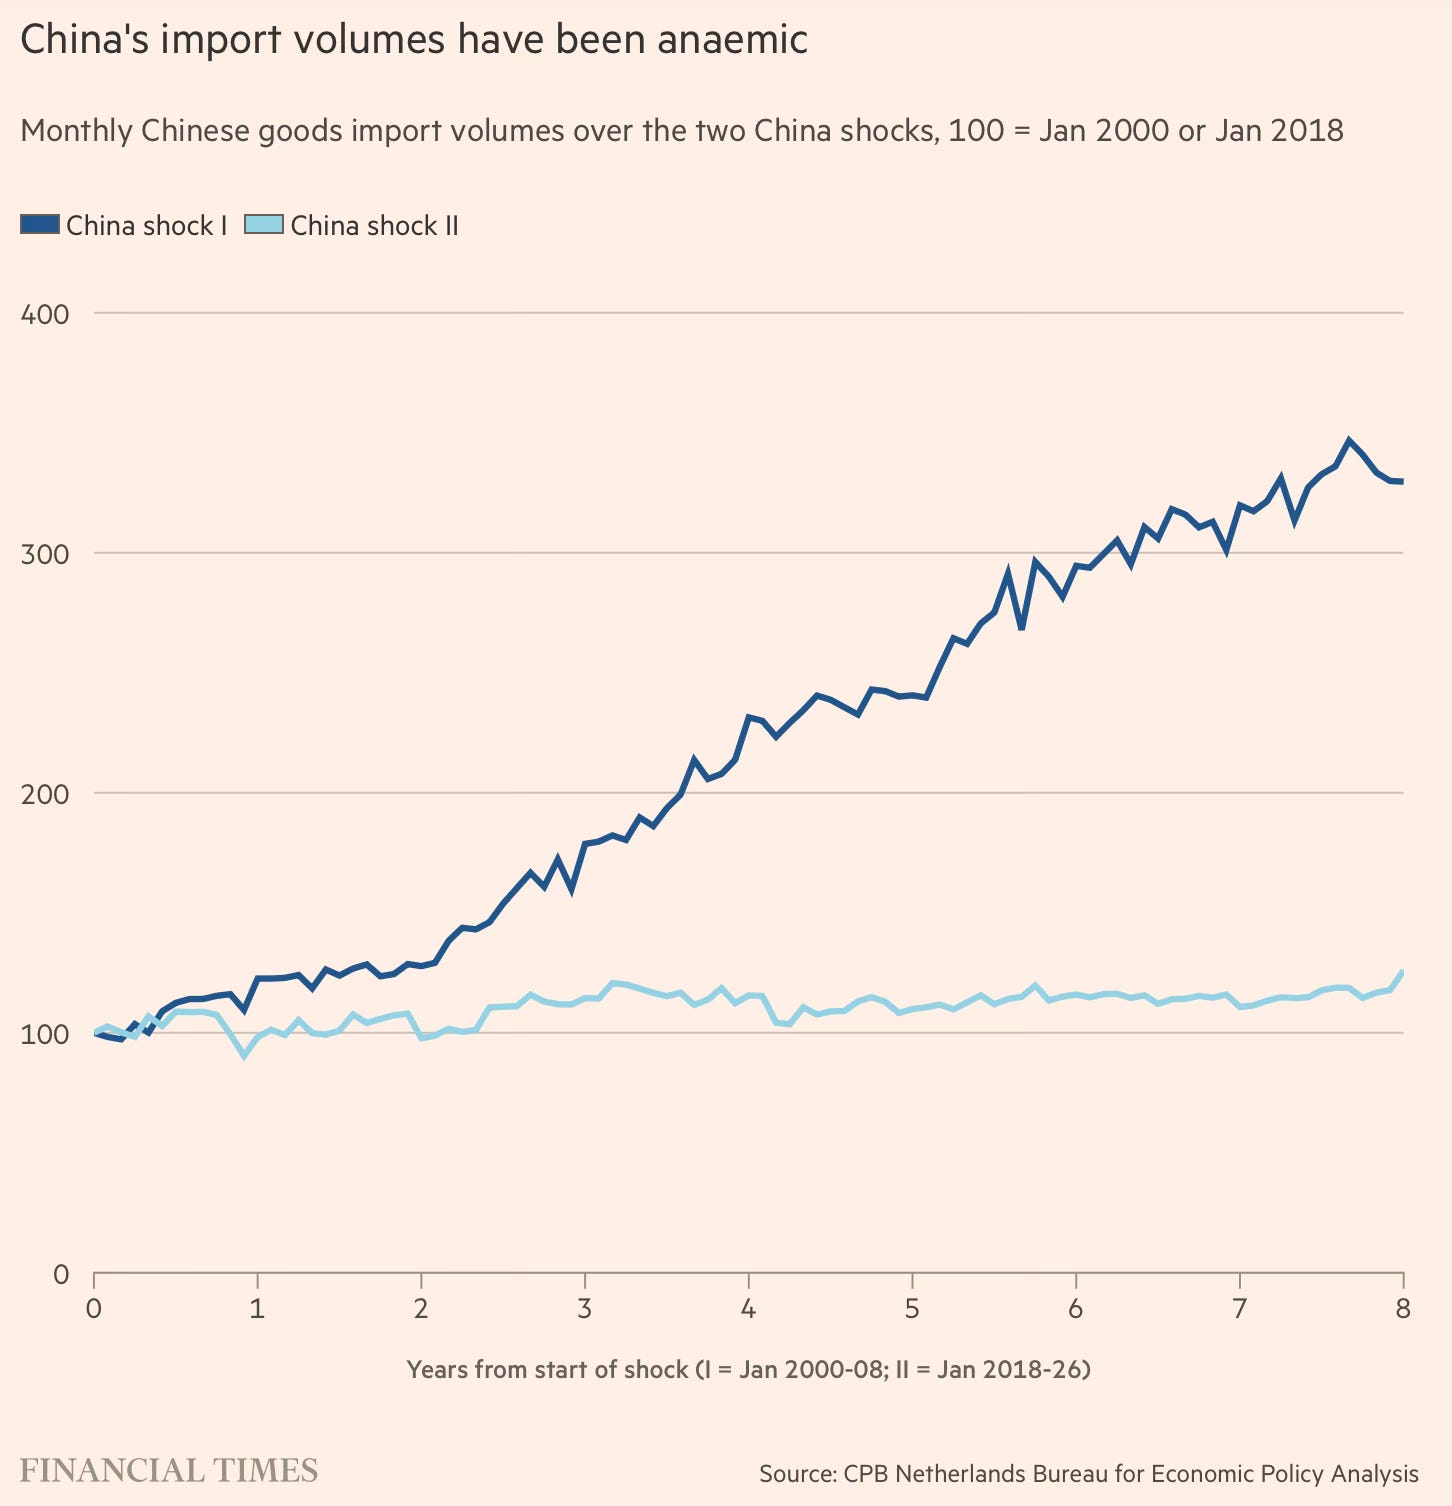
Chart: China's import volumes during the two China Shocks
The third difference is even more significant: China is increasingly less dependent on the rest of the worldThis advantage is most evident in metal refining. China holds a very high share of many strategic materials such as
During China Shock 1.0, China imported significant amounts of machinery, components, and equipment to fuel its export engine. When China exported aggressively, other countries still benefited to some extent by selling inputs to China.
But in China Shock 2.0, China's imports have grown very weakly. The reason is that they have increasingly localized more parts of the supply chain:
manufacturing more of their own machinery;
producing more of their own components;
controlling more of their own materials;
building more closed-loop industrial ecosystems.
Therefore, this shock is less symbiotic and more substitutive. As China exports more, the rest of the world no longer benefits as much as before through the sale of machinery, components, or intermediate materials.
That is what makes China Shock 2.0 particularly dangerous: China is not just selling more - they are replacing more.
Electric vehicles (EVs) are therefore just the most visible front. Behind them lies a larger story: China is competing with the world in the very industries that the world once thought China could not dominate.
PART II - REAL DATA, REAL PARADOX: THE CHINESE EV PICTURE
2.1. An export curve no one expected
Before diving into the mechanics, it is necessary to look at the data - because the scale of this acceleration is so massive that describing it with adjectives alone could easily sound like hyperbole.
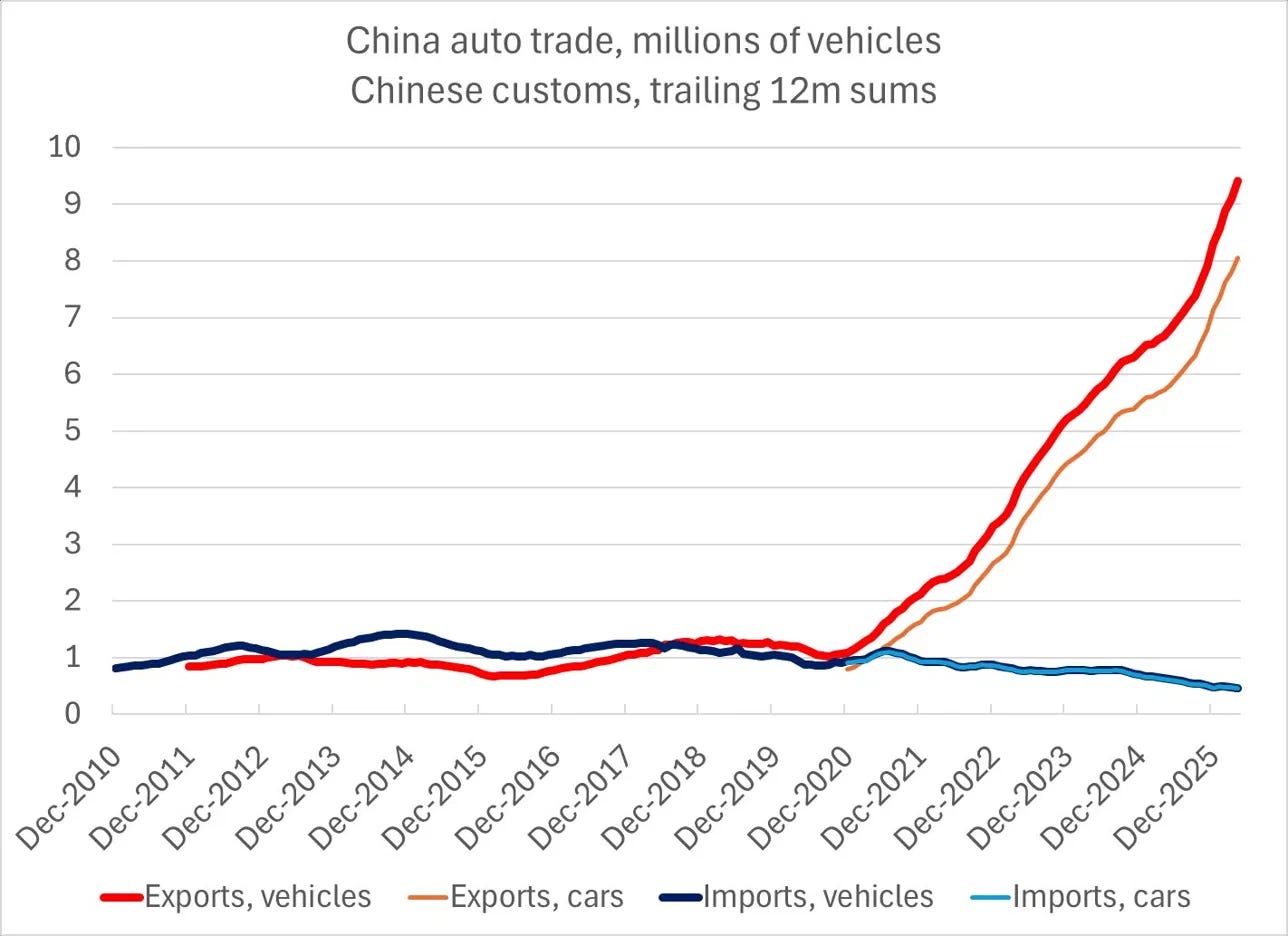
Chart 1: China's auto trade, million vehicles - China Customs data, 12-month rolling total
This is one of the most important charts in this week's article.
From December 2010 to December 2020 - nearly a full decade - China's vehicle export curve remained almost flat in the range of 0.8–1.3 million vehicles per year. There were no major breakthroughs. No signs that China was about to become a global auto export powerhouse. The import curve was also relatively stable, reflecting a familiar structure: China was a major consumer market, while Germany, Japan, the US, and South Korea were the ones selling cars to the world.
Then, from late 2020, the curve began to turn vertical.
December 2021: exports rose to approximately 2.5 million vehicles per year
December 2022: approximately 4 million vehicles
December 2023: approximately 5.5 million vehicles
December 2024: approximately 7 million vehicles
Early 2026: approaching 9.5 million vehicles - and still accelerating
Meanwhile, vehicle imports into China moved in the opposite direction: falling from the range of 1.0–1.2 million vehicles per year down to approximately 0.5 million vehicles. This is not just a trade shift. This is a structural change in consumption: Chinese buyers are moving away from foreign cars - especially German and Japanese internal combustion engine (ICE) vehicles - to domestic EVs and plug-in hybrids.
The most noteworthy point is not the absolute figure, but the speed of the reversal. In the global auto industry, where supply chains, brands, dealerships, safety standards, and consumer habits typically change very slowly, such a curve is almost a historical anomaly.
This export engine was not built overnight. But once it started running, its growth rate far exceeded most traditional forecasting models.
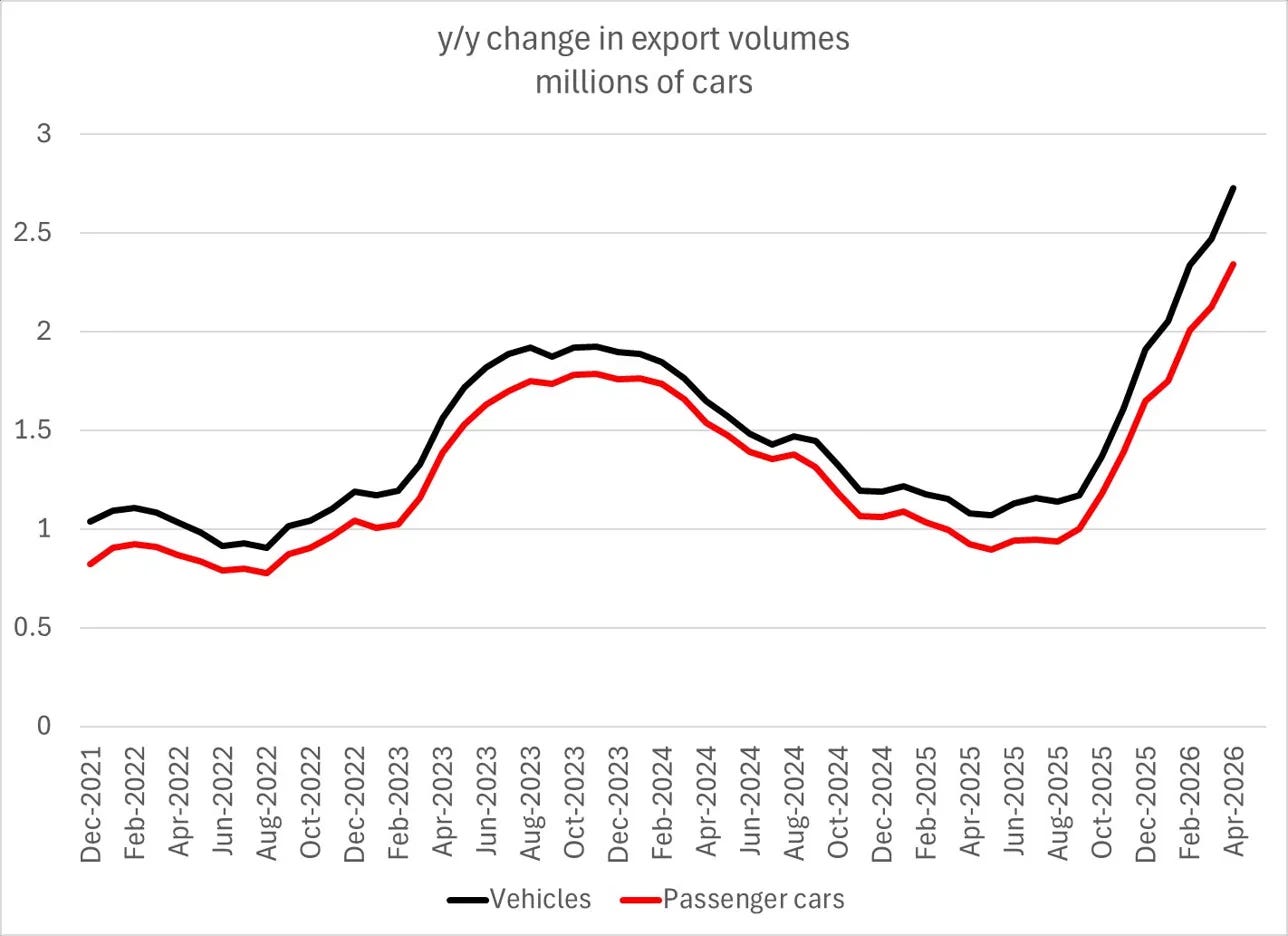
Chart 2: Year-on-year change in vehicle exports, million vehicles - Period from December 2021 to April 2026
The year-on-year change chart adds an important layer of analysis: Chinese exports are not just increasing, they are entering a second wave of accelerationThis advantage is most evident in metal refining. China holds a very high share of many strategic materials such as
. Between April and October 2023, the year-on-year export increase peaked at approximately1.8–2.0 million vehicles
. At that time, many might have thought this was the cycle peak: after the post-Covid boom, growth would cool down, a higher base would drag down the rate, and the global market would gradually absorb the new vehicle volume.
But that did not happen. After a correction down to the range of1.0–1.2 million vehicles , from late 2025 to April 2026, the absolute growth rate broke out again to the range of 2.5–2.7 million vehicles
- the highest level in the entire data series.
There are two drivers behind this breakout.
First, if oil prices remain high due to geopolitical tensions, global EV demand could accelerate faster than expected. When fuel becomes an invisible tax on consumers, electric vehicles are no longer just a green choice; they become an economic one.
Second, China's export wave is finding new niches outside the US and EU. Southeast Asia, Latin America, the Middle East, and Africa are becoming more important absorptive markets. As wealthy markets erect barriers, developing markets become the next strategic space.
In other words, this is no longer a story of China selling cars into a few open markets. This is the story of a massive manufacturing engine constantly seeking places to offload capacity.
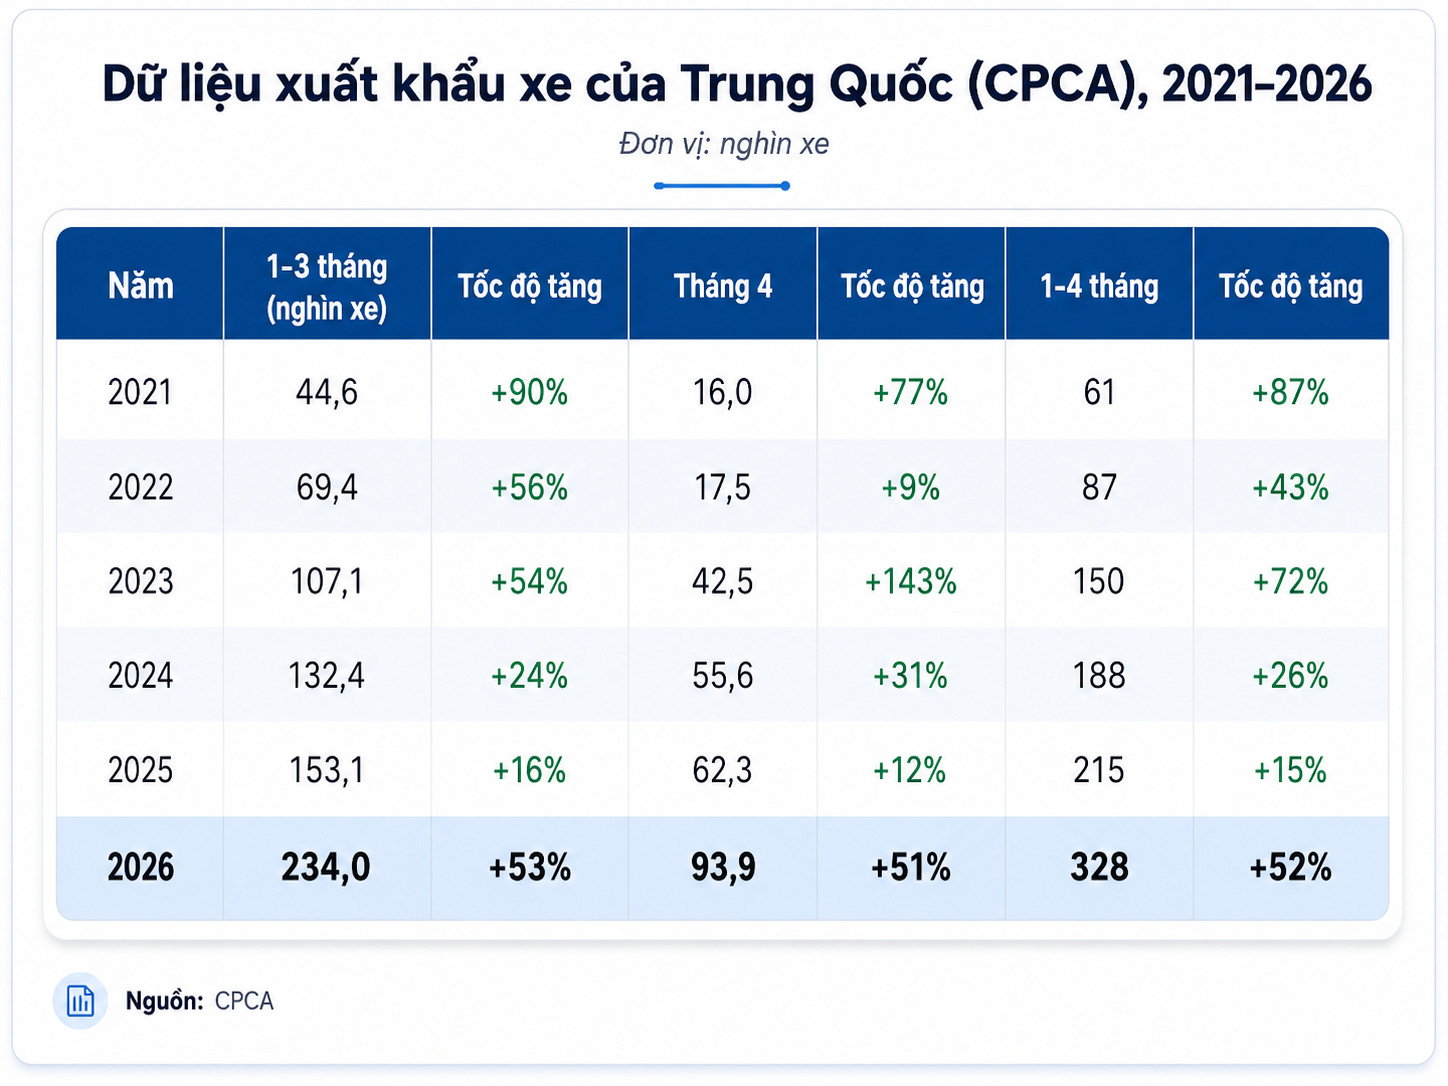
Data from the CPCA puts this acceleration into a clearer short-term context. In April 2026, China exported$56.9 billion , up 51% year-on-year. In the first four months of the year, total vehicle exports reached$56.9 billion 54% 52% year-on-year. Export value reached$56.9 billion $130 billion/yearThis advantage is most evident in metal refining. China holds a very high share of many strategic materials such as
. . Notably, the growth rate in 2026 - approximately 52–53%- is significantly higher than in 2025, when growth was only around
15–16% . This shows that the breakout in early 2026 is not just statistical noise, nor is it merely a low base effect. It is a genuine acceleration.If this pace is maintained, China's vehicle exports could reach the range of 1.05–1.1 million vehicles per month, equivalent to approximately
12 million vehicles per year
. This is a threshold that almost no one would have included in a base case scenario just a few years ago.
And more importantly: this figure is not just large for China. It is massive for the entire global auto industry.
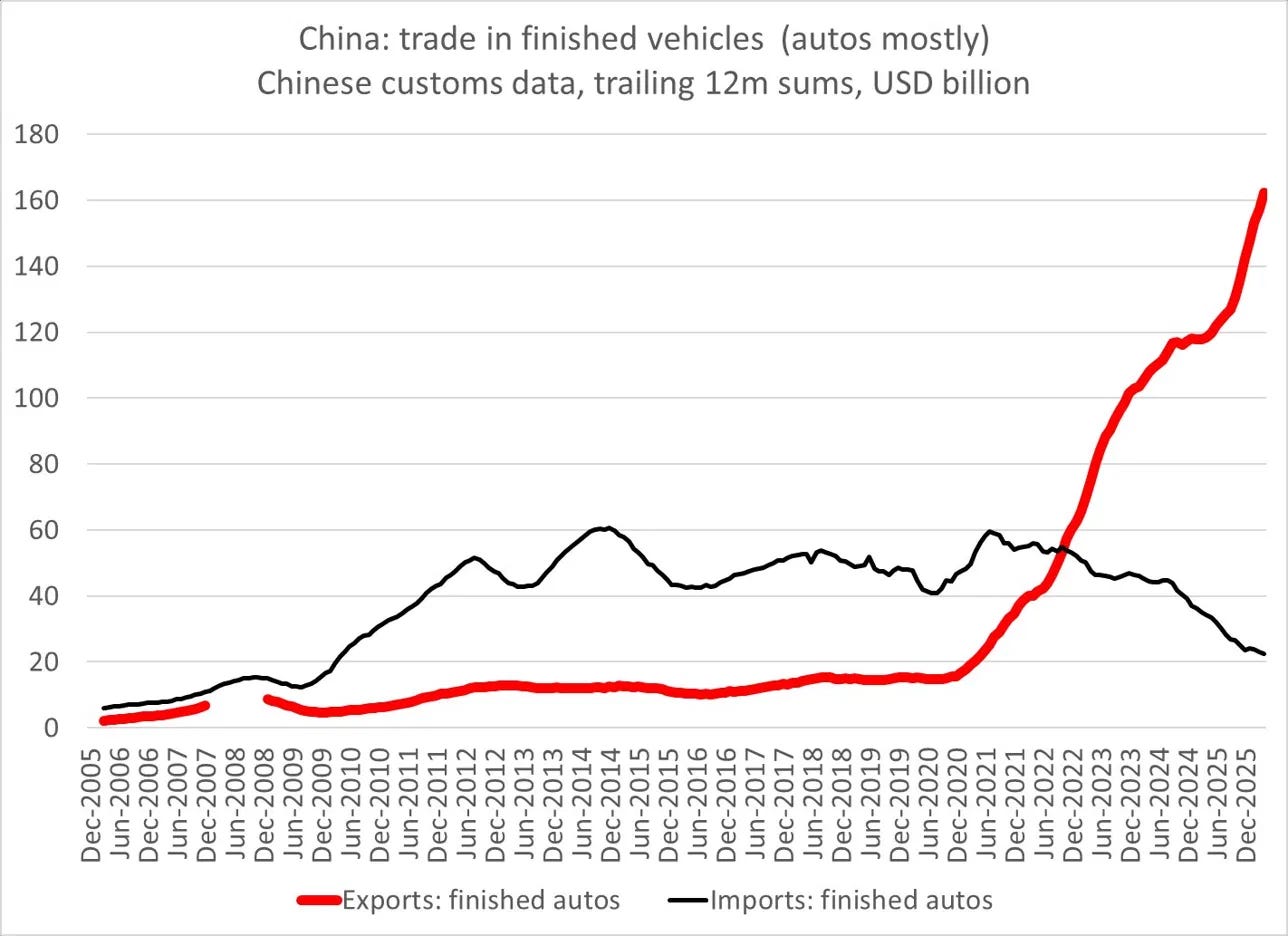
The USD value chart shows the reversal even more clearly. Chart 4: China's finished vehicle trade, $ billion - China Customs data, 12-month rolling totalDuring the 2010–2020 period, China remained a net importer of cars by value. Vehicle imports typically fluctuated in the range of $40–60 billion per year, while exports hovered around
$10–15 billion
. This was the familiar structure of the previous era: China produced in volume but still imported high-end, high-tech, and strong-brand vehicles from Germany, Japan, and the U.S. By the end of 2025, the curves intersect and completely reverse.
Chinese vehicle exports: approximately $160 billion/year
Vehicle imports into China: approximately $25 billion/year
Vehicle trade surplus: over $130 billion/yearA crucial detail: export value is growing faster than volume. In 2026, export value rose by approximately 54%, outstripping the volume growth of about
52%
. This gap is not massive, but it is enough to suggest that China is not just selling more cars; it is gradually selling higher-value vehicles.
This is what distinguishes China Shock 2.0 from China Shock 1.0.
China Shock 1.0 was primarily about cheap consumer goods, low-cost labor, and assembly. China Shock 2.0 is about EVs, batteries, software, clean energy supply chains, and higher-tech industrial products. In other words, China is no longer just competing at the bottom of the value chain. They are climbing the rungs that the West once thought were relatively safe.
2.2. Domestic Reversal: When EVs Kill ICE
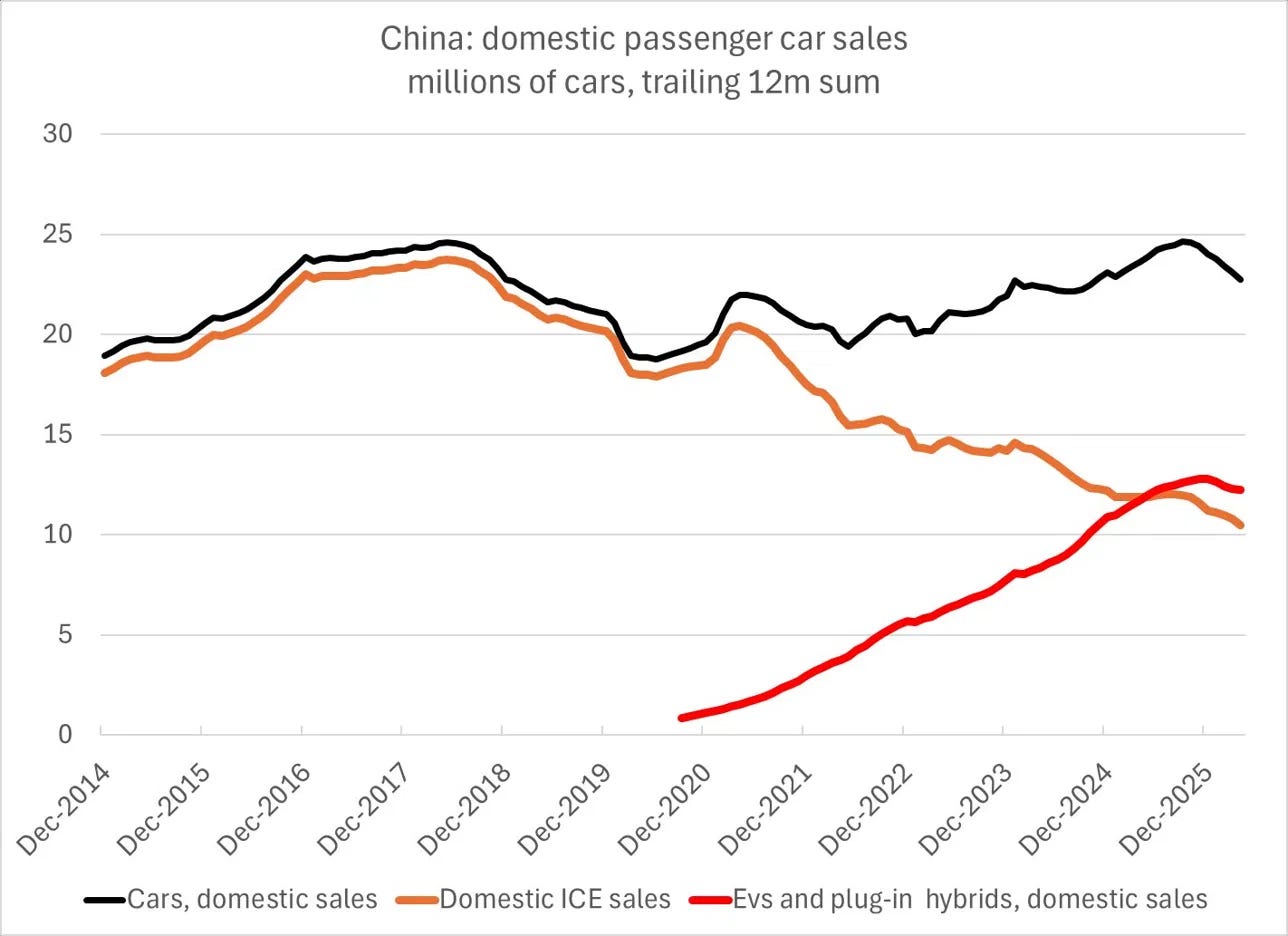
Chart: China's domestic passenger vehicle sales, million units, 12-month rolling total
This chart is one of the most striking illustrations of the speed of structural change in the auto market - and it directly explains why exports are forced to rise. Three lines to watch:
Black line - Total domestic vehicle sales: Stable in the 20-25 million range since 2014. On the surface, the Chinese market hasn't shown exceptional growth. But this average masks the revolution happening within. Orange line - ICE (internal combustion engine): After peaking at around 23-24 million units in 2016-2017, the orange line has plunged almost continuously to about 10-11 million units by late 2025. This represents a decline of nearly
60% over 8 years - one of the fastest market share collapses in global automotive history. Red line - EVs and plug-in hybrids: From under 1 million units in late 2020, the red line climbed vertically to 12-13 million units by late 2025. Within 5 years, EV/PHEVs captured more than
12 million units
of domestic market share - almost a 1:1 replacement of the lost ICE volume. This explains why foreign automakers are losing market share in China at an astonishing rate:
VW, Toyota, Honda, and GM are all strong in ICE - a segment that is disappearing
The total market share of foreign vehicles in China dropped from
60% (2020) to approximately 30% (2025)
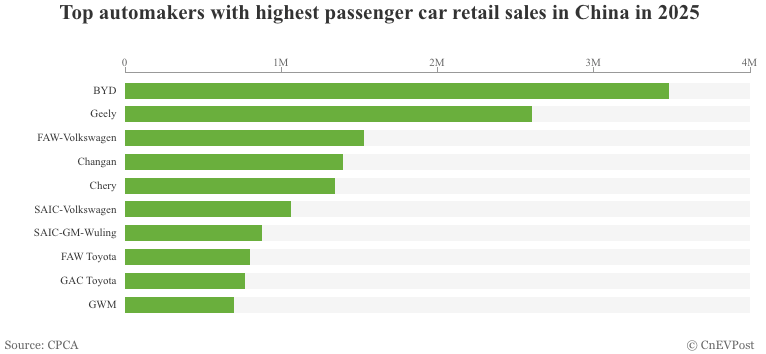
BYD alone holds 20% of the NEV market; Geely is close behind Two key takeaways from this chart: The EV revolution in China is not merely a policy imposition - it is a consumer choice. When domestic EVs are better, smarter, and cheaper than foreign ICE vehicles, the purchasing decision requires no further intervention. And the majority of export growth comes from electric vehicles: in April 2026, exports of EVs and plug-in hybrids rose
111.8%
- significantly higher than the 80.2% increase in total exports. The war in Iran is driving global EV demand faster than expected.
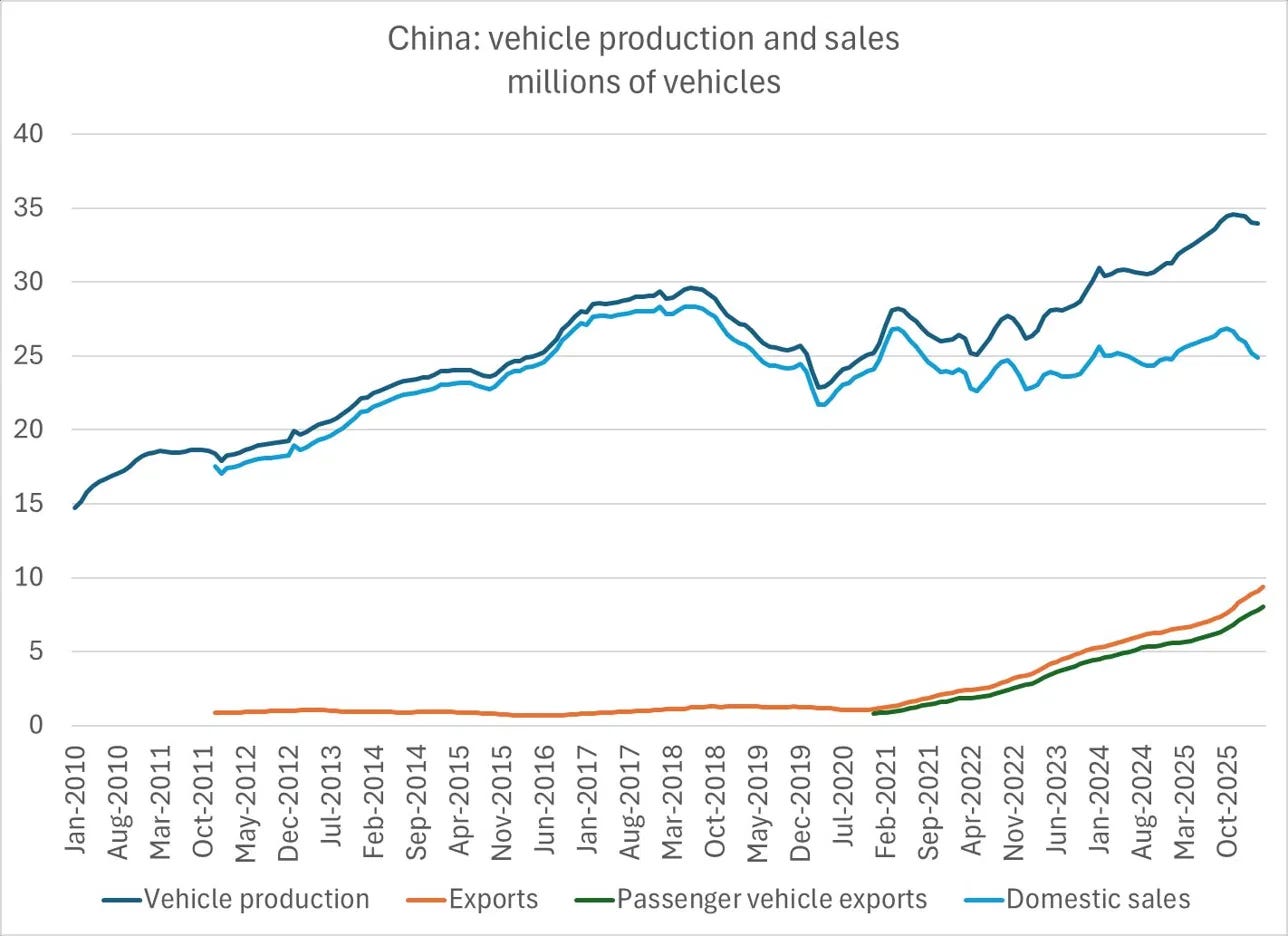
Chart: China vehicle production and sales - millions of vehicles This chart places the export story in its proper causal framework. Looking at the three lines since 2021:
Vehicle production (black line): Continues to climb steadily from ~28 million to ~34-35 million, with no signs of slowing down
Domestic sales (blue line): Almost flat around the 25-26 million range after the 2021 recovery
Exports (orange line): From near zero to ~10 million
The gap between production and domestic sales is exports.
And that gap is widening relentlessly.
This means that, structurally, production growth is no longer being absorbed by the domestic market. Since 2021, almost all output growth in the Chinese auto industry has come from exports. If exports are blocked, the result will be unprecedented overcapacity - and domestic price pressure will become far worse than it is now. 2.3. Winners and Losers: Reading the Financial Picture Correctly
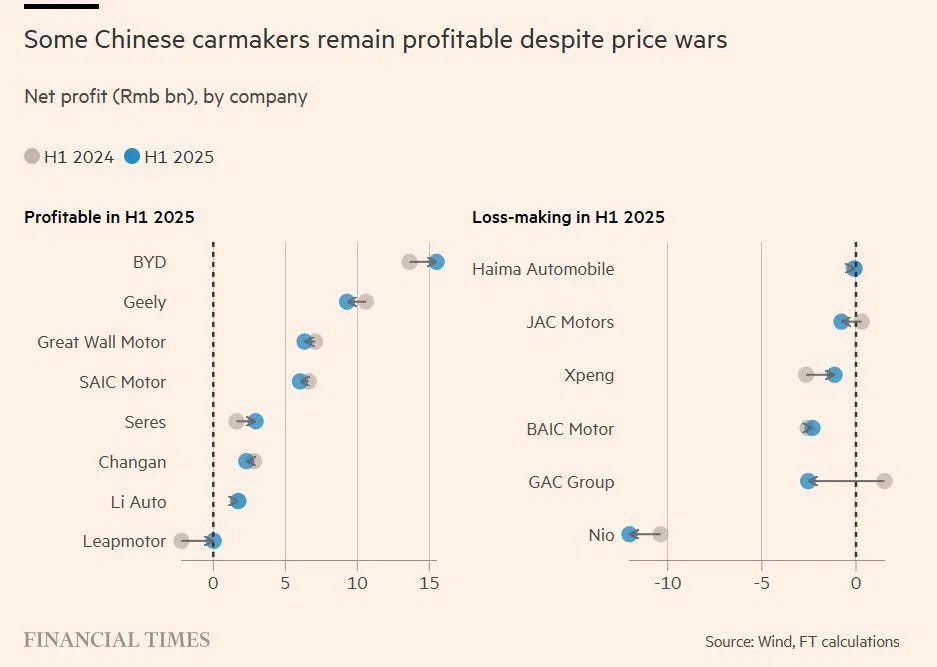
Chart: Some Chinese automakers remain profitable despite the price war, Net profit by company, billion yuan -
Source: Wind, Financial Times
This chart highlights a crucial point: the Chinese auto industry is not a monolith. Some firms are still making good money, while many others are being dragged deep into losses by the price war.
Among the profitable group, BYD is the standout, with a profit of about 15 billion yuan in H1 2025. It remains the industry's clear champion: massive scale, vertical supply chain, in-house battery capabilities, and price competitiveness that far outstrips most rivals. Geely follows with about 9–10 billion yuan, demonstrating that its multi-brand strategy and international expansion are paying off.
Companies like Great Wall Motor and SAIC Motor maintained profits in the 5–6 billion yuan range, while Seres, Changan, Li Auto, and Leapmotor reported smaller but positive profits, mostly between 1–3 billion yuan.
This refutes an oversimplified argument: one cannot say the entire Chinese auto industry is selling at a loss.
However, the other side of the chart reveals the dark side of the price war. Several firms are under immense pressure: GAC Group plunged deep into losses, potentially reaching around
-10 billion yuan or more.
Nio remains heavily in the red, though losses have narrowed compared to H1 2024.
BAIC Motor, Xpeng, and JAC Motors are all in negative territory, to varying degrees.
Haima Automobile is smaller, but illustrates how weaker players are being pushed to the fringes of the market.
Therefore, the real story is not "China is selling at a loss industry-wide," nor is it "China is winning entirely through market efficiency." The more accurate narrative is:
profits are concentrating among a few champions, while the rest of the ecosystem is dragged into an increasingly brutal price war. There are three takeaways from this chart:
Not everyone is losing money: BYD, Geely, and several major players still post significant profits.
Profit distribution is highly skewed: if BYD is excluded, the industry's financial picture becomes much bleaker.
Trends matter more than current figures: GAC plunged into losses, Li Auto improved, and Leapmotor turned positive - indicating that the industry is restructuring very rapidly.
The brief conclusion is:
some Chinese automakers remain healthy, but the entire industry is under massive margin pressure.
For strong firms, exports are a way to expand margins. For weak ones, exports are a hope for additional outlets before being phased out. For the system as a whole, exports are a way to delay a domestic shakeout that no one wants to happen too quickly.
That is the financial paradox of the Chinese auto industry: not everyone is losing, but too many businesses need the outside world to survive.
2.4. BYD and the Paradox of a Struggling King
BYD is the most noteworthy case study in this picture, as the company represents both the success and the limitations of the Chinese model. Q1/2026 Data: Net profit: 4.1 billion yuan ($600 million), down
55%
year-on-year
The lowest level since Q2/2022 Revenue: 150.2 billion yuan, down 11.8%
Domestic sales: the
8th consecutive month of decline Four headwinds are simultaneously hitting BYD:
Government EV subsidies are being phased out - part of the previous boom was fueled by artificial stimuli
The mass market is saturated - the sub-150,000 yuan segment is plunging
Competition from Geely, Leapmotor, Xiaomi, and Huawei-powered vehicles is eating into market share
Pressure from Beijing to pay suppliers faster
- eliminating a source of cheap financing that BYD once relied on BYD's response is to ramp up exports - where margins are much thicker than domestically: Sales in the UK and Europe more than
doubled in Q1/2026, reaching nearly 74,000 vehicles Launching the premium brand
Denza in Europe to compete with Porsche and BMW Investing in
8 dedicated container ships capable of carrying 9,000 vehicles each - ready to pivot as soon as markets open
"Sell at low margins in China, profit abroad"
- this model is essentially cross-subsidization in trade theory, though BYD does not use the term. This is also why Western governments feel justified in questioning fairness.
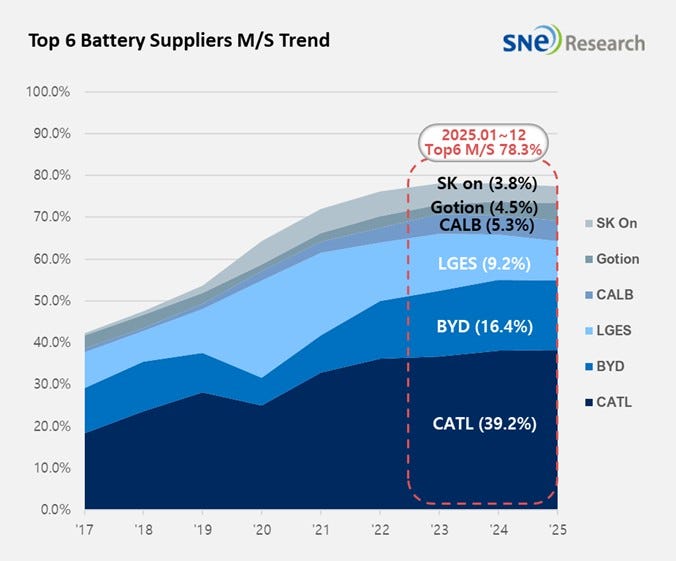
PART III - BATTERIES, EXCHANGE RATES, AND THE WEAPONIZATION OF SUPPLY CHAINS 3.1. Batteries: An advantage that cannot be replicated overnight If cars are the most visible front of China Shock 2.0, then
batteries
are a deeper structural advantage - and much harder to catch up with. According to SNE Research data through 2025, China has secured a dominant position in the EV battery value chain: China: accounts for , the investment calculus changes rapidly. Why would an automaker build an expensive plant in Canada if the end market is open to competitors with lower costs, deeper supply chains, and stronger support? of the global EV battery market share, up from approximately
50% in 2021. South Korea: fell from over 30%This advantage is most evident in metal refining. China holds a very high share of many strategic materials such as
15.3% . Japan:This advantage is most evident in metal refining. China holds a very high share of many strategic materials such as
7% . CATL: alone accounts for
39.2% of the global market - larger than the combined market share of South Korea and Japan.This advantage does not come from subsidies alone. It stems from the experience curve: in battery production, every time capacity doubles, costs can drop by an average of
20–25%
. China entered the game early, scaled up quickly, and accumulated cost advantages year after year.
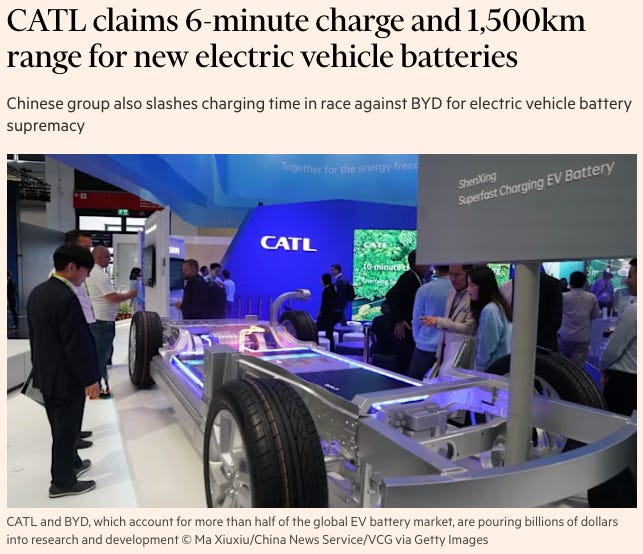
The result is a self-reinforcing loop: Large scale → lower costs → better profits and cash flow → higher R&D → better technology → even larger scale.Therefore, the gap is not easily narrowed. In 2025, China's lithium-ion battery exports reached approximately $77 billion . Battery production costs have fallen by more than 90% in a decade. By May 2026, CATL announced a battery with a range of
1,500 km on a single charge - a signal that China is not only winning on price but also advancing rapidly in technology. The West is trying to break this loop with the IRA in the US and industrial policies in Europe. But the problem is:
batteries are just the tip of the iceberg.
Behind batteries lies a much deeper industrial ecosystem. 3.2. Electro-state: An advantage deeper than batteriesThis advantage is most evident in metal refining. China holds a very high share of many strategic materials such as
cheap electricity, metallurgy, chemicals, state financing, and a massive manufacturing ecosystem . China did not just build a battery industry. They built a type of
electro-state - an industrial machine powered by electricity, where production layers are tightly linked from inputs to final products.
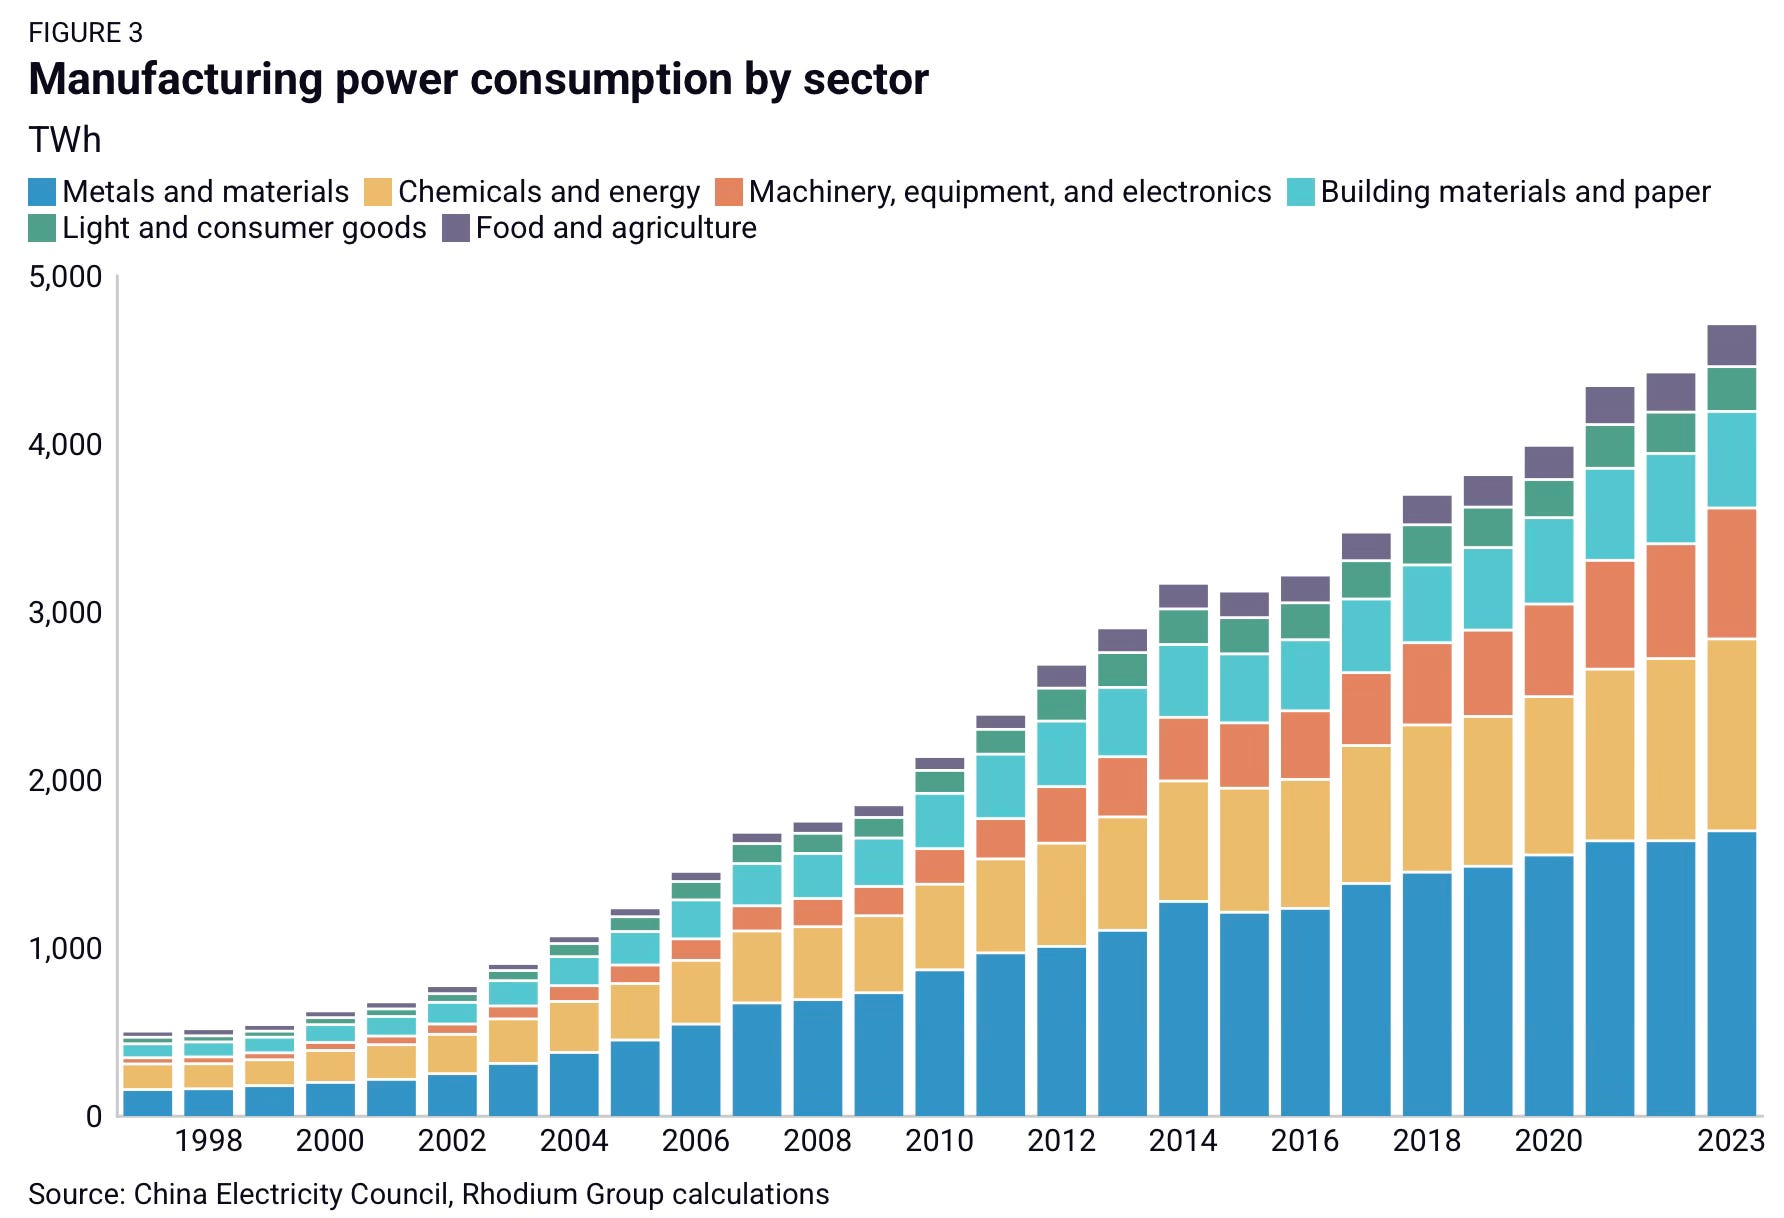
Chart: Electricity consumption in Chinese industrial production by sector Unit: TWh - Source: China Electricity Council, Rhodium GroupThis chart shows that Chinese industry is built on a very physical foundation: large-scale electricity . Sectors such as
metals, chemicals, energy, machinery, equipment, and electronics
have all seen sharp increases in electricity consumption over the past two decades.
This explains why China's advantage is difficult to replicate. To compete with Chinese EVs, an assembly plant is not enough. A whole ecosystem is required:
cheap and stable electricity;
large-scale metallurgical capacity;
chemical and material supply chains;
a dense network of component suppliers;
a domestic market large enough to guarantee demand; a financial system that accepts low margins over the long term.This advantage is most evident in metal refining. China holds a very high share of many strategic materials such as
the entire physical infrastructure behind EVs .
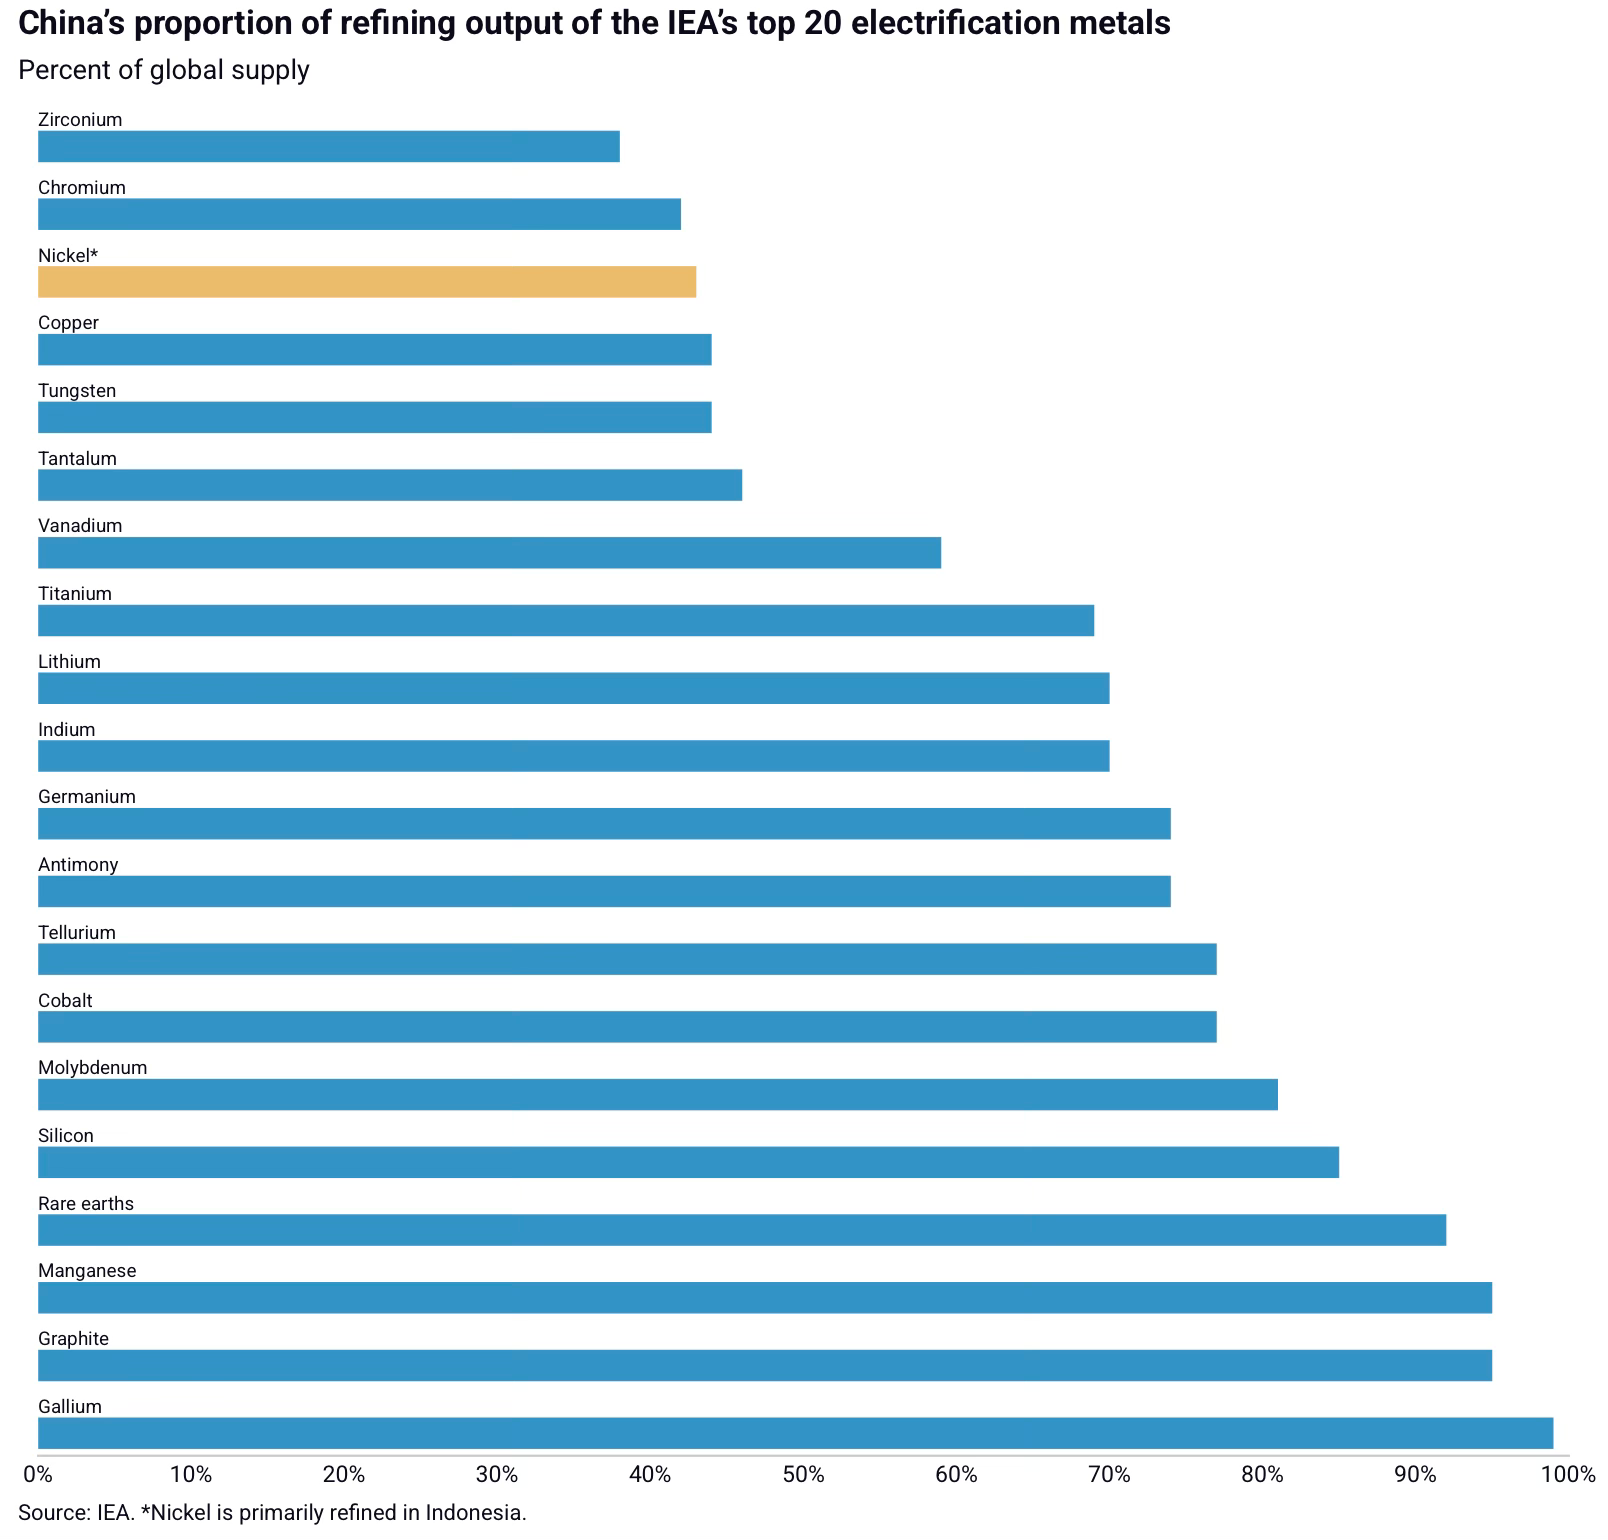
Chart: China's share of refined production for 20 key electrochemical metals by the IEA Unit: % of global supply - Source: IEAThis advantage is most evident in metal refining. China holds a very high share of many strategic materials such as
solar panels; industrial equipment.Crucially, many of these metals require more than just mines. They need capacity
for processing, refining, and byproduct recovery
. In many countries, recovering gallium, germanium, or tellurium is often uneconomical due to small markets and uncertain demand. But in China, a massive downstream ecosystem-spanning phones, batteries, LEDs, semiconductors, EVs, and solar panels-generates enough demand for refining to operate at scale.
The loop thus becomes: Large-scale downstream production → stable demand for minor metals → more profitable refining → more stable material supply → even stronger downstream production.
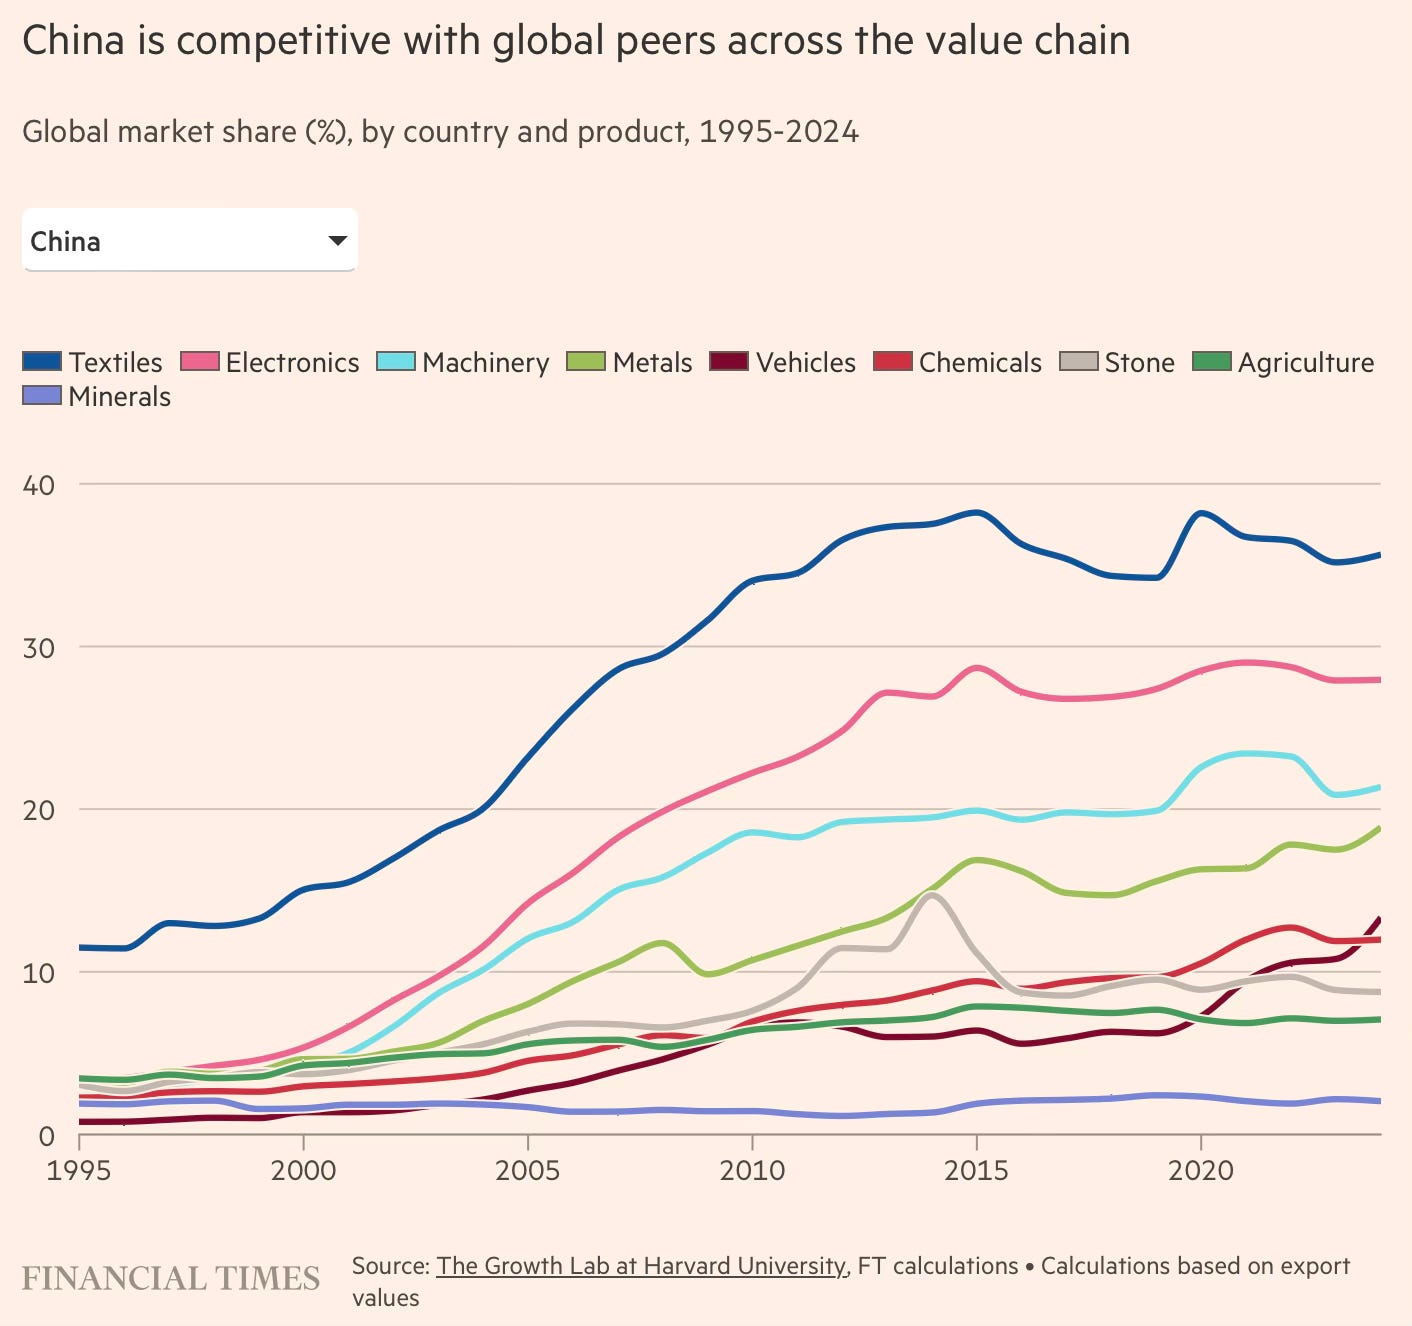
Chart: China's global market share by product group, 1995–2024 Unit: % global market share - Source: Harvard Growth Lab, FT calculations The global market share chart shows a similar trend at the value chain level. China is no longer just dominant in textiles or cheap consumer goods. They have increased their market share in
electronics, machinery, chemicals, vehicles, metals and many other product groups.
This is the core of China Shock 2.0:
China is not abandoning old industries to move into new ones. They are maintaining the old while simultaneously advancing into the new. Therefore, the "diversify away from China" strategy sounds much simpler than it actually is. A Western company might move an assembly plant to Mexico, Vietnam, or Eastern Europe. But if batteries, magnets, cathode materials, graphite, rare earths, silicon, gallium, and many intermediate inputs still come from China, then only the surface of the supply chain has moved-the backbone remains within the Chinese ecosystem.
That is the deepest advantage of China Shock 2.0:
China does not just control the final product; they control multiple layers of the materials beneath it. 3.3. Weaponizing the supply chain: The strategic window is closingChina controls approximately 60-70% of global rare earth production and more than
90% of processing capacity
. Rare earths are essential materials for permanent magnet motors in EVs, wind turbines, and a wide range of defense applications.
Rare earth export restrictions were tightened in October 2025-just as the EV market was booming. The logic behind this move: If the West attempts to produce its own batteries and EVs, it will still need rare earths from China-at least for the next few years This gives Beijing
temporary leverage
but a valuable one But this strategy carries two major risks: It pushes the West to accelerate diversification: The U.S. has committed
$439 million to alternative rare earth sources; Australia is expanding its rare earth mines; and Western corporations are approaching Africa. The 2010 history with Japan during the East China Sea dispute is a clear lesson: when China restricted rare earths to Japan, the response was to accelerate diversification-and that leverage diminished very quickly.
The strategic window is closing.
The question is how effectively China will use it before it shuts.
PART IV - THE WORLD'S RESPONSE: A NEW MAP OF A BLOODLESS WAR
4.1. Europe: From "win-win trade surplus" to an "existential question"
Chart: Chinese automakers’ 2025 market share by country in Europe - Reuters/Inovev
This map of Europe is one of the most visual representations of the penetration speed of Chinese vehicles-and the surprising differences between countries within the same economic bloc. High market share group - what makes the difference?
Norway: 14% - Unsurprising. Norway is the world's most developed EV market, has no domestic auto industry to protect, and Norwegian consumers buy the best cars at the best prices regardless of origin
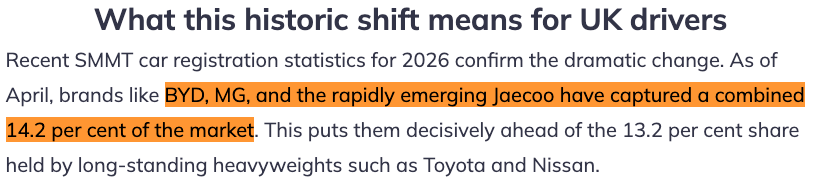
UK: 11% - and rising fast. The UK has not imposed additional tariffs on Chinese cars, lacks an auto industry large enough to lobby the government, and British consumers are reacting strongly to rising fuel prices
Italy, Spain: 9%
each - surprisingly high, as both have strong domestic auto industries (Fiat/Stellantis, SEAT). This shows consumers are voting with their wallets, regardless of government preferences Low market share group - why?
Germany: 2% - Surprisingly low. German consumers are loyal to domestic brands, additional EU tariffs reduce the price advantage, and VW/BMW remain competitive in the premium segment
France: 3% - The French government has implemented implicit restrictions through EV subsidy criteria that only apply to European-made vehicles. This is trade policy via industrial policyWhat this chart doesn't show, but is equally important:
the 2025 figures will look completely different from 2026 . The UK jumped from 4.9% (2024) to 9.7% (2025) and then to 14.6% (first 4 months of 2026). If similar trends apply to the rest of Europe, next year's map will be significantly redder. French President Emmanuel Macron has been the most outspoken: the surge of high-quality Chinese goods is
an "existential question"
for European manufacturing. This is not hyperbole-it is a real economic analysis, as the European auto industry accounts for millions of direct and indirect jobs.
4.2. Canada: The most interesting model and policy lessons
Canada is a unique case in China Shock 2.0, caught between two opposing pressures: the ambition to build a domestic EV industry with massive industrial subsidies, and the very real appeal of cheaper, feature-rich Chinese EVs that are increasingly accepted by consumers.
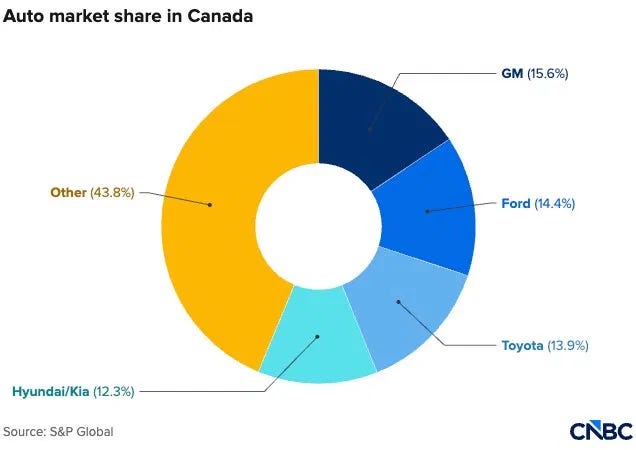
Chart: Auto market share in Canada - S&P Global The Canadian auto market is currently dominated by traditional manufacturers:
GM: 15.6%
Ford: 14.4%
Toyota: 13.9%
Canada is therefore more than just a small market. It is a policy test for the entire West: industrial policy cannot be sustained if the end market is open to a competitor with a cost structure that cannot be replicated domestically. China has barely appeared on this chart. But that could change if Canada allows approximately 49,000 Chinese EVs per yearinto the market with a tariff of 6.1% , instead of the
100% rate applied to other Chinese vehicles. The figure of
49,000 vehicles
is not enough to upend the entire market immediately, but it is enough to create a real test:
large enough to exert competitive pressure;
small enough not to disrupt the market overnight;
sufficient for Canadian consumers to test Chinese cars through actual purchasing behavior; enough to test whether Canada's domestic EV industry can compete.The problem is that this test comes just as Canada's EV strategy is faltering. Canada has spent tens of billions of dollars to attract EV manufacturing, but several major projects are struggling:
Northvolt's bankruptcy, GM's delays, and Honda's pause on a $15 billion EV investment
. This shows that industrial policy is only effective when three conditions coexist:
EV demand grows fast enough;
Western companies commit long-term capital; the domestic market is protected long enough from low-price competition.If Chinese EVs are
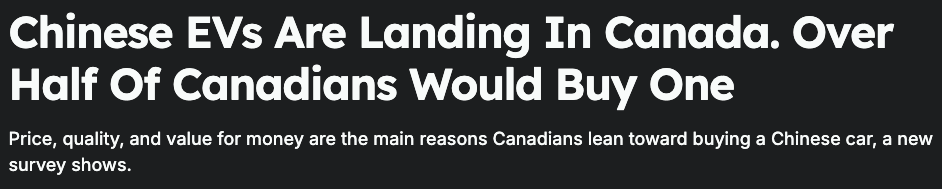
30–40% , the investment calculus changes rapidly. Why would an automaker build an expensive plant in Canada if the end market is open to competitors with lower costs, deeper supply chains, and stronger support? From the consumer's perspective, the story is very different. An AutoPacific survey shows that more than
50%
of Canadian car buyers are willing to consider Chinese vehicles. The reasons are practical:
lower prices;
rapidly improving quality;
better range;
more technology;
more attractive value for money. Simply put: consumers don't buy "industrial strategies." They buy the best car within their budget.But from a policy standpoint, the risk is not just economic. Chinese EVs are not ordinary trade goods, as modern vehicles are
data platforms on wheels
: location, driving behavior, sensors, cameras, software, and over-the-air updates. If deeply dependent on Chinese vehicles, Canada is not just importing cars; it could be importing data risks, security threats, and geopolitical leverage.
Therefore, the Canadian dilemma is not "whether to let citizens buy cheap cars." The real question is: How much industrial capacity and data security is Canada willing to sacrifice for cheaper EVs in the short term?
This is the paradox of China Shock 2.0: opening up provides quick wins for consumers but risks weakening domestic industry in the long run; protectionism preserves manufacturing capacity but forces consumers to pay higher prices.Canada is therefore more than just a small market. It is a policy test for the entire West: industrial policy cannot be sustained if the end market is open to a competitor with a cost structure that cannot be replicated domestically. China has barely appeared on this chart. But that could change if Canada allows approximately 49,000 Chinese EVs per yearinto the market with a tariff of 6.1% , instead of the
100%
rate applied to other Chinese vehicles.
4.3. Two adaptation strategies: LEM and VW
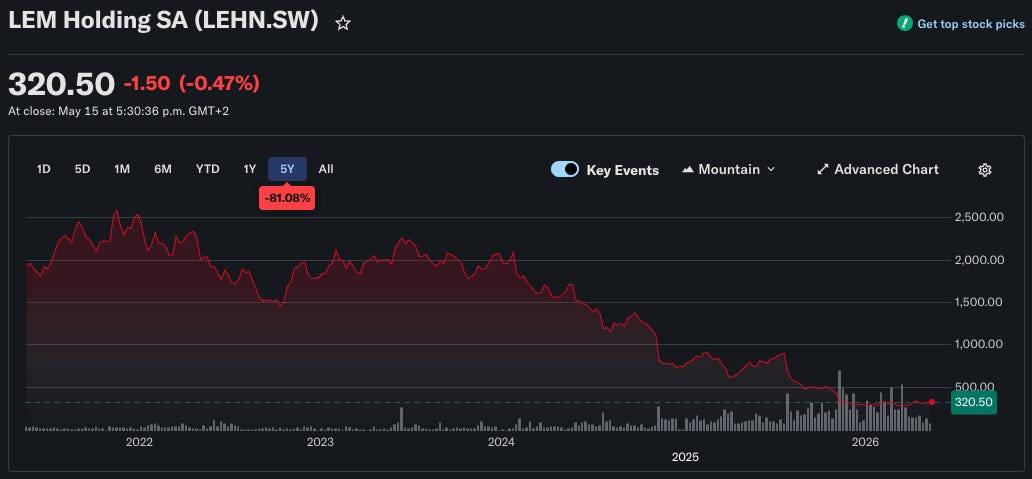
LEM - learning to "become more Chinese": LEM is a Swiss company specializing in current sensors - a product similar to Mega-Senway's but for higher-end applications. LEM's story is a perfect case study:
2022: Net margin of 19.4%, steady dividends 2026:Net margin 2.7% , dividends eliminated, shares lost
84% over 5 years Survival strategy:
Sourcing more from the Chinese supply chain, hiring 30 additional R&D engineers in Shanghai, and keeping pace with customer innovation.
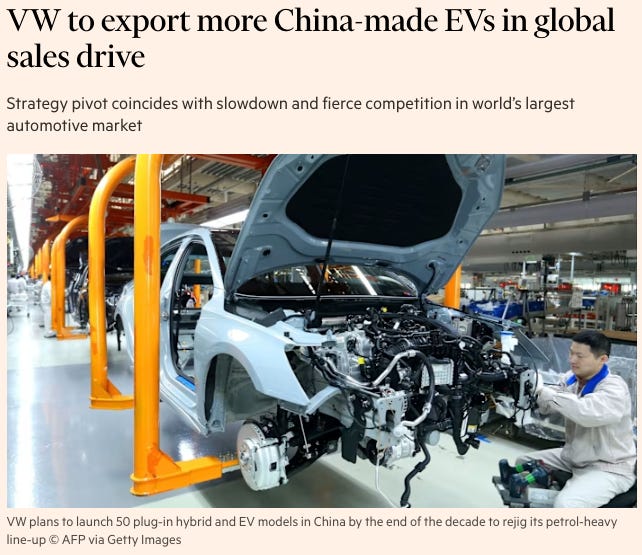
"We need to be close to our customers and work at their speed" VW - the "if you can't beat them, join them" strategy:
Volkswagen is the clearest example of how Western firms are adapting to China Shock 2.0: not just competing with China, but starting to use China itself as an export hub.VW wants to export more China-made EV models to
Southeast Asia, the Middle East, Latin America, and Africa
. The reasons are practical:
lower production costs in China;
faster vehicle development; a deeper EV supply chain; technology learned from partners like Xpeng and
SAIC
helps VW compete more effectively in emerging markets. Notably, VW's strategy is shifting from: "In China for China"
to "In China for China - and for the Global South." This is not a simple concession. It is an admission that in the EV sector, China is no longer just a major consumer market. China has become
a low-cost, high-speed production platform with technology strong enough
to serve the entire world. The paradox lies here: a German corporation that once brought technology to China to conquer Chinese consumers must now use its technical and manufacturing capabilities in China to compete in other markets.
→ This is a sharp symbol of China Shock 2.0:
even Western firms must become "more Chinese" to survive in a game shaped by China.
PART V - THREE SCENARIOS FOR THE REST OF THE DECADE
Having looked at the full picture, the final question is: what happens next? There is no neat "solution," but three scenarios can be outlined, determined by a combination of four variables:
Four key variables:
The speed of Western market closures and the determination to maintain protectionist policies
This is the most likely scenario - not because it is a good one, but because neither side has enough leverage or will to fundamentally change the status quo quickly.
Characteristics of this scenario:
China continues high-speed exports, but markets gradually shift toward developing nations. Exports to the EU rose 21.1% and to Southeast Asia gained 20.5% in Q1/2026, signaling this trend.
In China, industry consolidation occurs but is slow and painful: It is estimated that only 15–20 of over 100 EV manufacturers will remain financially viable by 2030 - but the process will take years.
In Europe, policy chaos: some countries impose tariffs, others do not. The UK could see Chinese vehicles reach a 20% market share in the coming years, creating fertile ground for protectionist politics (Nigel Farage and Reform UK have already begun exploiting this issue).
In the US, the wall remains high, but pressure from consumers (rising car prices, high gas prices) and Trump’s dealmaking instinct create constant instability.
Consequences for the global economy:
The economy fragments into blocs with higher trade costs, redundant manufacturing capacity in multiple locations, and consumers in closed markets paying a protectionist premium while those in open markets benefit from low prices. The question of who wins the green tech race remains open.
This is a more optimistic scenario - not because pressure disappears, but because it becomes a catalyst for real change.
Characteristics:
Competition from China forces VW, GM, Ford, and Stellantis to restructure faster than they otherwise would.
The most dangerous loop in this scenario: In China, external pressure combined with a growing awareness of the costs of "neijuan" (involution) drives structural reforms: VAT reform, reducing zombie subsidies, and allowing industry consolidation.
Consequences:
The world gains more competitive manufacturing hubs with costs that aren't as low as a Chinese monopoly - but with more resilient supply chains. Consumers pay slightly more but receive a more diverse ecosystem with less risk of geopolitical disruption.
This scenario requires many things to align, and the history of industrial policy offers little optimism. But it is not impossible.
This is the scenario no one wants, but it must be considered as it explains risks currently underpriced by the market.
Potential catalysts - requiring at least one of the following:
A prolonged war involving Iran severely disrupts global supply chains while triggering an unprecedented surge in EV exports as high oil prices spike global demand.
A credit crisis in China linked to the EV sector exposes the scale of NPLs in the banking system - a compounding effect from real estate, LGFVs, and EV credit.
A trade war escalating faster than either side expects, accompanied by the full-scale weaponization of rare earths.
The most dangerous loop in this scenario: Multiple EV manufacturers face simultaneous liquidity crises → bank loans deteriorate sharply → credit tightens → production halts → job losses → social unrest → emergency government intervention with massive resources → the "neijuan" loop worsens in the long term despite short-term stabilization.
Consequences:
A global recession triggered by trade disruption rather than a traditional financial shock. This is the type of recession where monetary policy is least effective, as inflation and weak growth emerge from the same source.
CONCLUSION: A SHOCK WITH NO ONE TO BLAME
I want to conclude with what I believe is the central paradox of this entire story. In most debates over China Shock 2.0, people look for a culprit: Beijing for designing a system with unfair advantages; the West for creating the conditions for supply chain dependency; or corporations for chasing short-term profits.
But the reality is more complex:
no one truly controls this machine - not even its creators.
Huang Xian at Mega-Senway doesn't want to sell sensors for 10 yuan. He wants profit. The robotics founder in Western China doesn't want prices to drop 10% annually. Managers at BYD don't want profits to plunge 55%. Even Xi Jinping has spoken out to warn about "neijuan." The problem is that the machine has its own momentum. When millions of businesses, thousands of local officials, hundreds of state banks, and dozens of industrial policies collectively create a system that prioritizes output over profit - no one can stop on their own, even when everyone understands the system is unsustainable.
At trade shows, Huang meets his competitors - who also look miserable. One suggests:
"Can we ease up the tension a bit?" Huang says he wants that too.
"Then that person goes back and undercuts my price,"
Huang says.
This is a prisoner's dilemma on a macroeconomic scale. Every player knows the collective outcome is bad. But no one can unilaterally stop without paying a personal price. And no mechanism - not the market, not the state - is strong enough to break this loop quickly.
China Shock 2.0 has no single person to blame. It is a consequence of how the global economic system has been built over the last 30 years - based on the assumption that markets would coordinate, globalization would benefit everyone, and competition would always lead to an efficient equilibrium.