This is a series where Steve talks about the new services of Tạp Chí Phố Wall, focusing on usage as well as roadmap for future improvements, but also touching on the issues with current services and why Steve designed these functions this way.
Viet Hustler on Substack will not stop operating and will still run in parallel with TapChiPhoWall, the daily newsletter will be published on both sides
Currently, Steve has written up all the new changes in the Wall Street Journal.
Note: Steve cannot automatically transfer everyone's accounts from Substack to TCPW, so everyone:
Message Steve on Substack, Discord, or email steve.le@viethustler.com that you want to transfer
Steve is sending Wall Street Journal coupons with the unused money from Viet Hustler Substack (instead of issuing pro-rated refunds)
Steve will cancel everyone's auto-renew accounts on Substack
Everyone will use the coupon and self-register a new account on TCPW at https://tapchiphowall.com/pricing-plans
Thank you everyone for your support!
BLOG #1: INTRODUCTION TO WALL STREET MAGAZINE
Hello everyone,
Since Steve started Viet Hustler until now it has been 4 years (from mailchimp to substack) and first, Steve thanks the 11,000 subscribers whether Free or Paid who have always supported Steve and the team.
When Steve first entered the market, just like other investors, Steve realized that the biggest difficulty for investors in general and Vietnamese people in particular is access to information.
Traditional news channels face 3 problems:
News is too long → You can only read and digest a small amount of information per day
Analysis is often biased → Same data but each newspaper can say differently
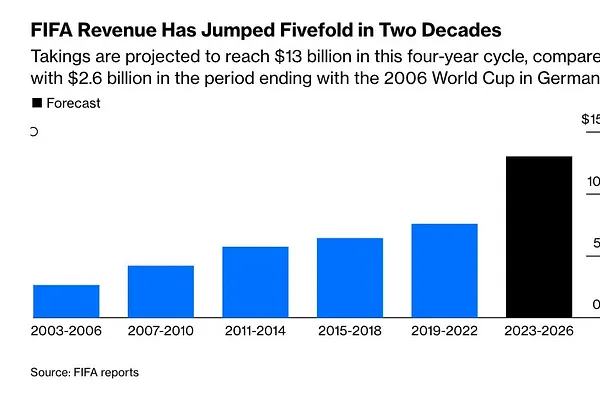
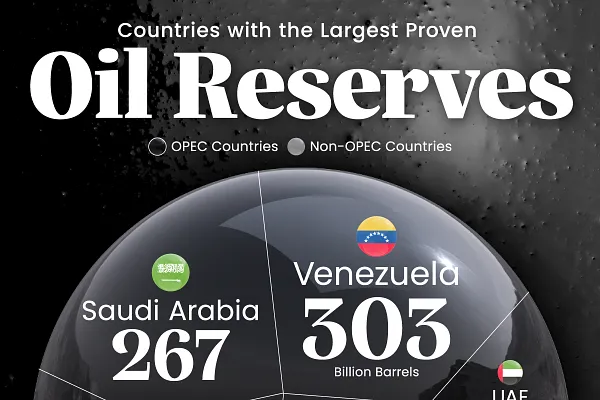
Too lacking in infographics → Cannot clearly see the big picture of data and trends
That's why Steve decided to create Viet Hustler with 3 criteria:
Short but comprehensive news → Only 1 bullet points and as few words as possible
Macro analysis focused on data → Market judgment instead of personal
Many infographics → Show readers instead of “telling” readers
Perhaps the approach of finding problems → providing solutions like that has been successful because starting from just a weekly newsletter, Viet Hustler has become a source of information that everyone trusts to read daily, known by many in the finance industry.
This is probably the success that Steve is most proud of.

After some time in the market and having the opportunity to get to know many other investors, especially from the Basic US Stocks Class and Options Seller, Steve has found more problems (problems) that Steve can provide solutions (solutions) for
According to Steve, these are the tools that an investor needs:
Quick news snippets that can move the market (Breaking News)
Macro data analyzed in an easy-to-understand way (Viet Hustler)
Economic event calendar and financial reports showing impact on the market
RRG Charts (for analyzing money flow rotation)
Concise, easy-to-understand, and well-illustrated financial data (Fundamental Analysis)
AI Model to support investing and help identify macro risks/opportunities
Easy-to-understand Options Gamma Model (GEX) that can actually be used in trading
However, the current products on the market have the following issues:
1. No all-in-one platform:
Each of the above tools is usually on a different website/product, making it difficult for users to use. For example:
To read fast news, you have to go to X
To view financial data, you have to use finviz
To view the economic events calendar, you have to go to investing.com
For options gamma, you have to use SpotGamma
2. Too complex:
Because each website focuses on only one product, they often go in depth, adding more information but lacking essentials, overwhelming beginners. For example:
X is a social network, search and filter are poor, hard to find what's needed
Financial data on Finviz is 60% redundant and hard to identify what's needed
SpotGamma goes too deep into Quant, nearly 90% don't know how to use it
3. Too expensive:
Because of point 2 → Each service needs to expand depth to compete with similar services and attract professional customers. However, this makes the service more complex and especially more expensive
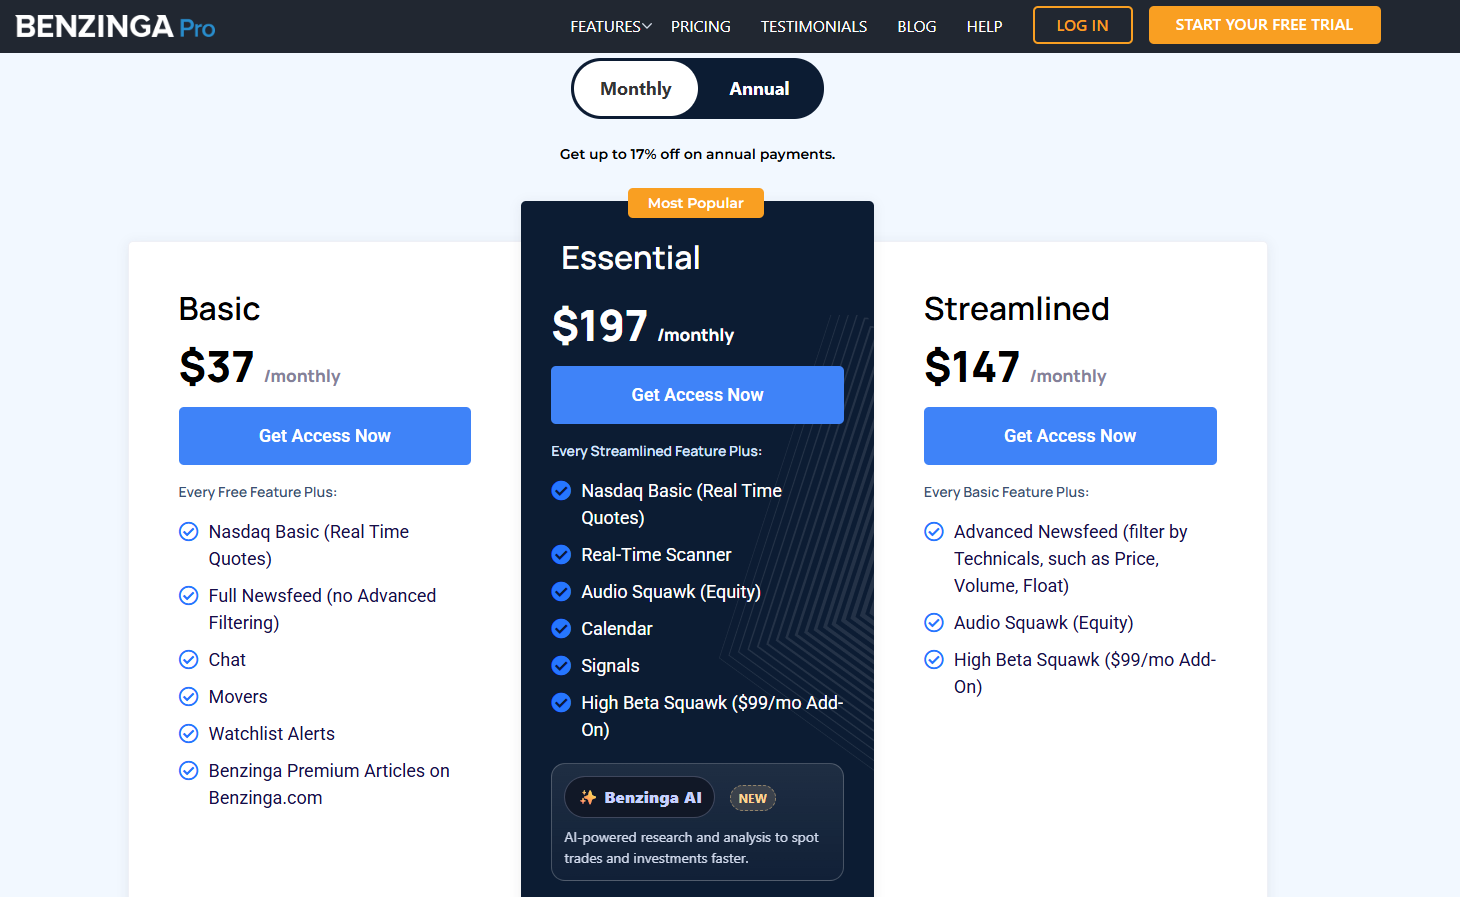
BenzingaPro $37/month for fast stock news
Even $197/month just to have people read the news (which can completely be done by AI)
Fiscal (formerly Finchat) $49/month to view revenue, profit, and financial charts
SpotGamma Pro $129/month to view gamma map (including VIX and individual stocks)
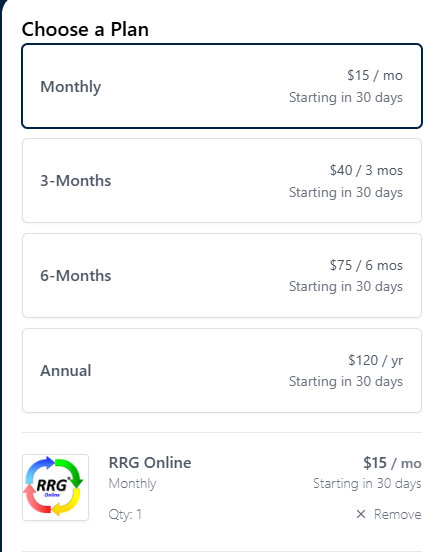
RRG Online $15/month just to view RRG Charts
→ Just these 3 services alone are $230/month and doesn't include many other necessary things.
4. AI models are not good
Steve has tried many AI models for stock and financial analysis, from raw models to custom trained ones that require payment. Almost none help much in investing:
Really good AI models used by institutional traders are only for internal use, and not accessible to retail traders
AI models that retails can access are mostly made by retail traders with technical knowledge, lacking the analysis system like institutional investors → if you don't know the steps for stock analysis, how can you teach AI?
One of the biggest issues Steve sees with retail AI models is they are mainly for trading, focusing on technical analysis or real-time market data scanning → According to Steve, this is not the optimal way to use AI
Solution
1. All-in-one Platform:
All essential investor tools in one product
The new platform will need to use website and be easy to use on both desktop and mobile. Especially no app needed to avoid 30% AppStore tax
Note: Viet Hustler Steve sets price at $8.99/month, on iPhone App is $12.99/month because Apple takes an extra 30%
2. Practical instead of depth
80/20 Rule: If 20% effort takes you 80% of the way, focus on that 20% first.
Steve's services won't need to go deep to serve all professional traders, just focus at a 'sufficient' level for most investors.
Especially focus on 'data access speed' instead of 'data depth'
In the market, 'speed' has its own quality.
If you deeply analyze 1 stock taking 30 minutes, in a day you'll only analyze 10 stocks and pick 1
Steve analyzes not deeply, but sufficiently the important surface level, 5 minutes per stock, Steve can analyze 100 stocks a day
→ High chance that 1/100 stocks Steve picks will be better quality than 1/10 you can pick
This will also reduce complexity, cut costs, and be more user-friendly for non-professional investors.
3. Must have guidance
There is a lot of market data, from economics (macro) to finance (fundamental) to even gamma, lacking information for investors to at least understand what they are looking at. Sometimes just a simple definition and explanation of a few technical terms, and of course, it needs to be in Vietnamese.
Investing.com explanations are too long and yet still lack details
SpotGamma has no Vietnamese and is really too hard to understand
A few examples that Steve will use to explain
4. Price must be cheap enough
Focus on value and products with suitable prices, everything else will come naturally.
And this is more important: Find good partners and share your vision (Thank you Tú)
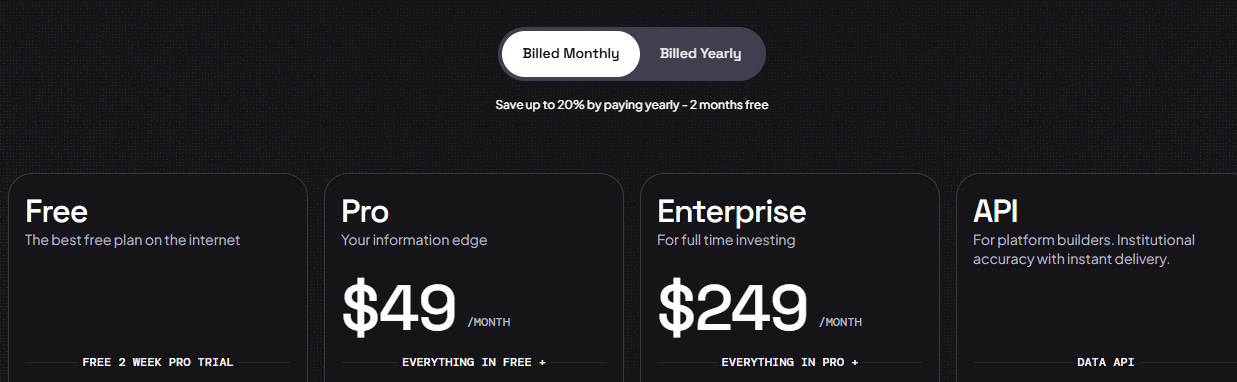
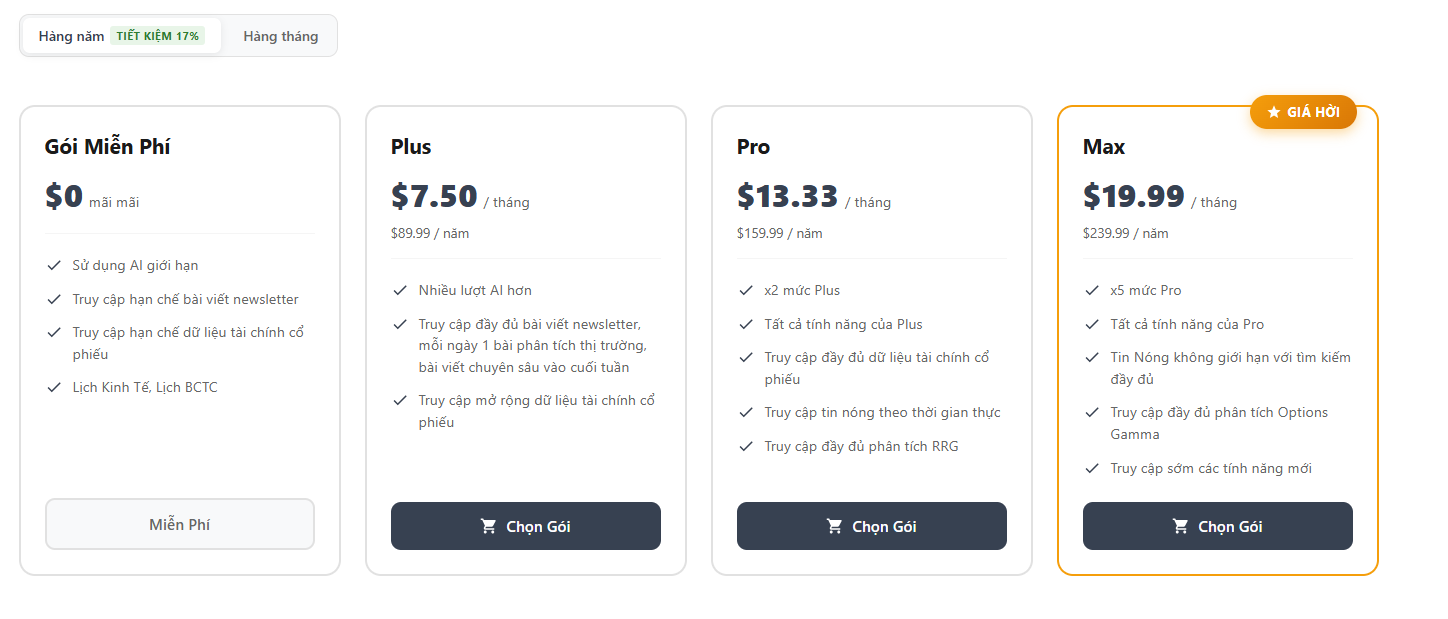
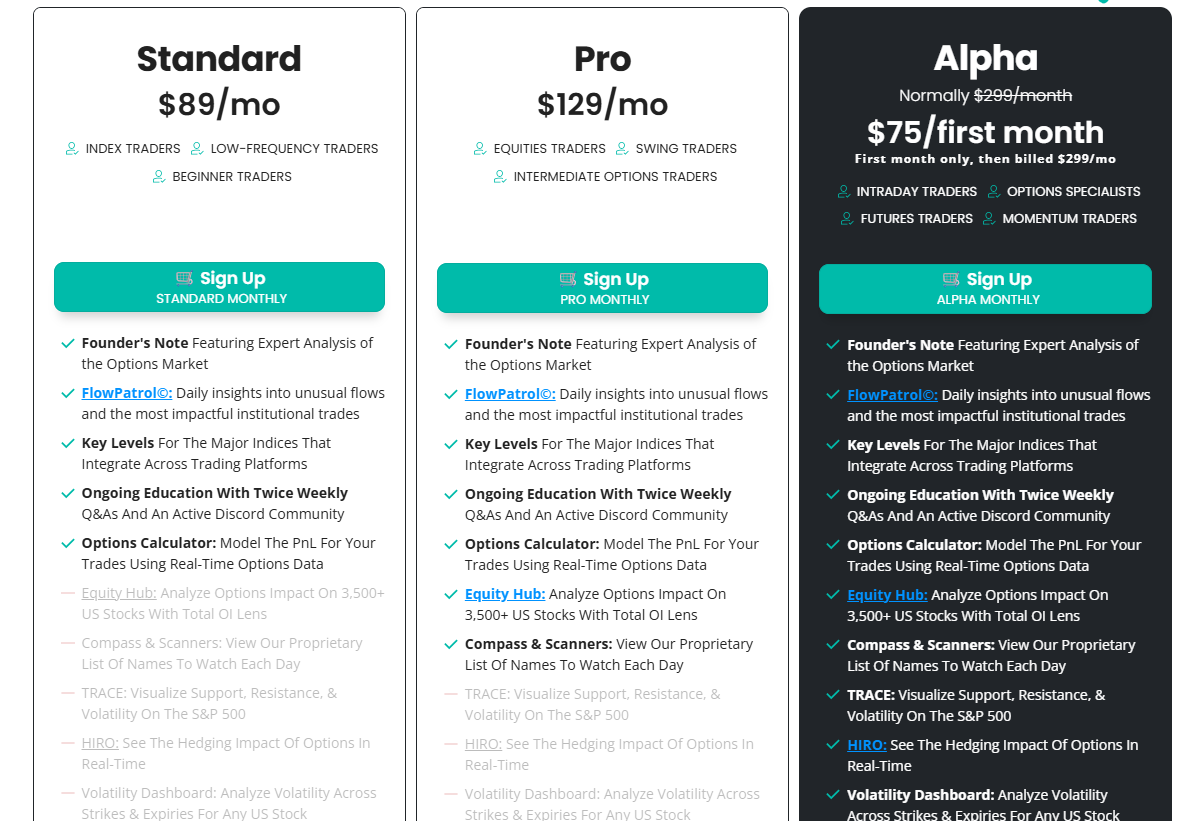
This is the pricing table for TapChiPhoWall - with MAX including all the tools mentioned above
This will be the first article in a series where Steve talks about the new services of Tạp Chí Phố Wall, focusing on usage as well as roadmap for future improvements, but also touching on the issues with current services and why Steve designed these functions this way.
On behalf of the whole team, thank you everyone!
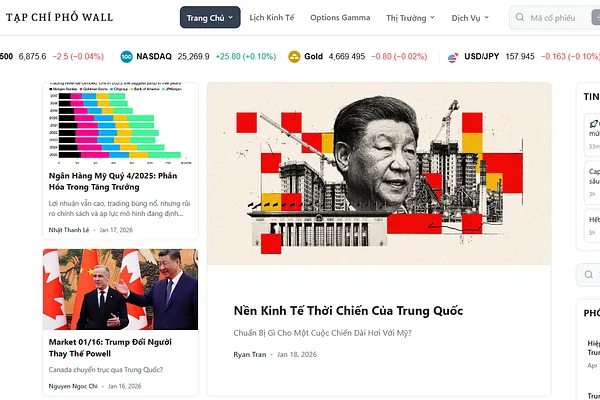
Currently Steve has set up a new website on
https://tapchiphowall.com/
if anyone wants to switch from Viet Hustler to Tạp Chí Phố Wall, just go to the new website to register, then message Steve via Substack, Discord or email: steve.le@viethustler.com to receive pro-rated refund from Viet Hustler.
BLOG #2: Viet Hustler, Quick News And Pre-Market Note
In this first change section, Steve will go over the free items and those inside Tier PLUS of Tạp Chí Phố Wall.
Plus is almost to serve subscribers transferring directly from Viet Hustler, however it includes a few additional services:
1. Newsletter Viet Hustler:
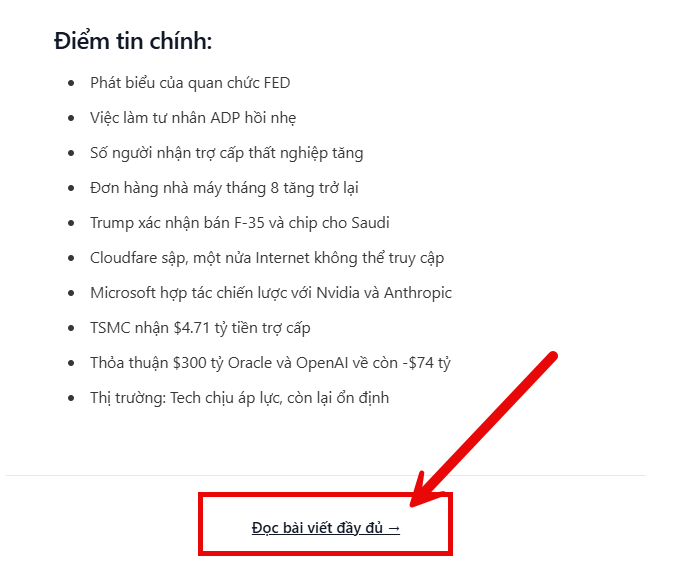
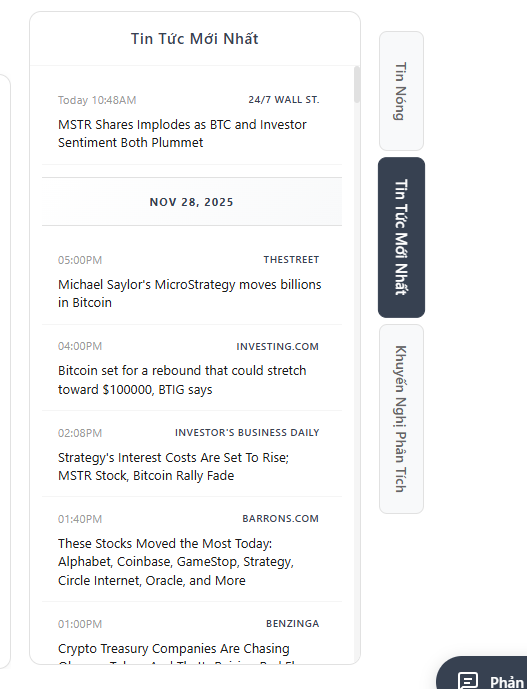
Includes all future and past articles that VH has ever published, with the difference being the email delivery.
The only difference will be in the email delivery method
→ Emails from Tạp Chí Phố Wall will only include the general content (free) followed by a link to go to the website to read the full content.
Most articles exceed the character limit in email
Solve the email forwarding issue (sharing free articles)
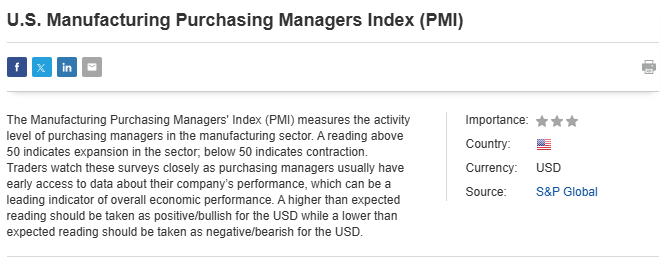
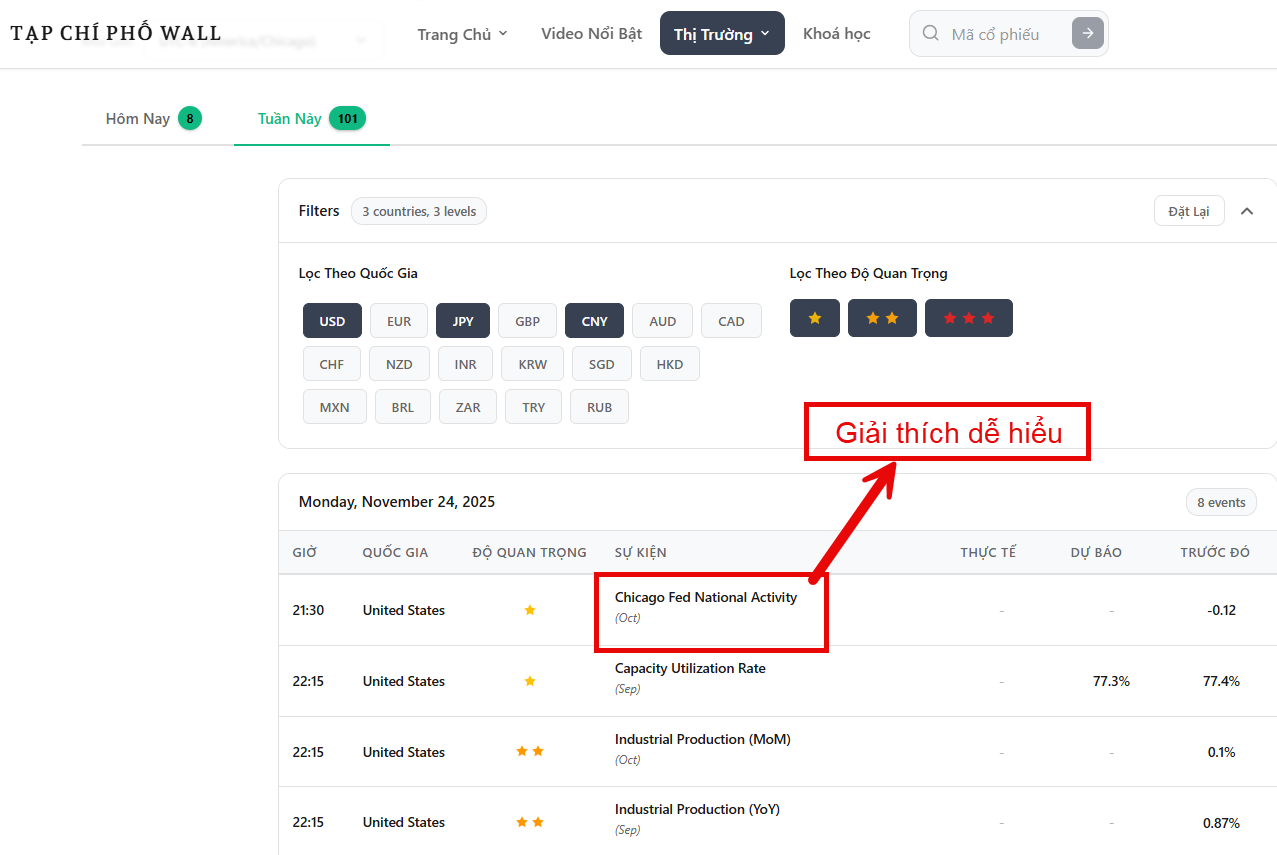
2. Economic data calendar
Similar to Investing.com - however with easier-to-understand explanations about the data and its impact on the market
Goals:
Data easier to view and track than on investing.com
Mark market-moving events in the week
Easier explanations of important economic data
Roadmap:
Save user preferences
Add updates for easier-to-use features
Create more easy explanations
Mark extremely important weekly events
3. Financial reports calendar:
Financial reports are what investors need to pay most attention to, however aggregation sites are often:
Too diluted, many small stocks due to trying to serve many customers
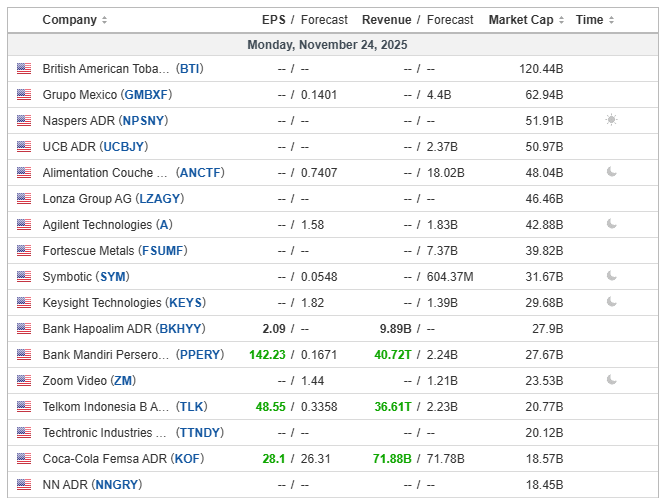
Lacking easy-to-view event calendars, often have to follow on X.
Good example:

Tạp Chí Phố Wall will develop similar to the above but:
Easier to access
With interaction to easily track results
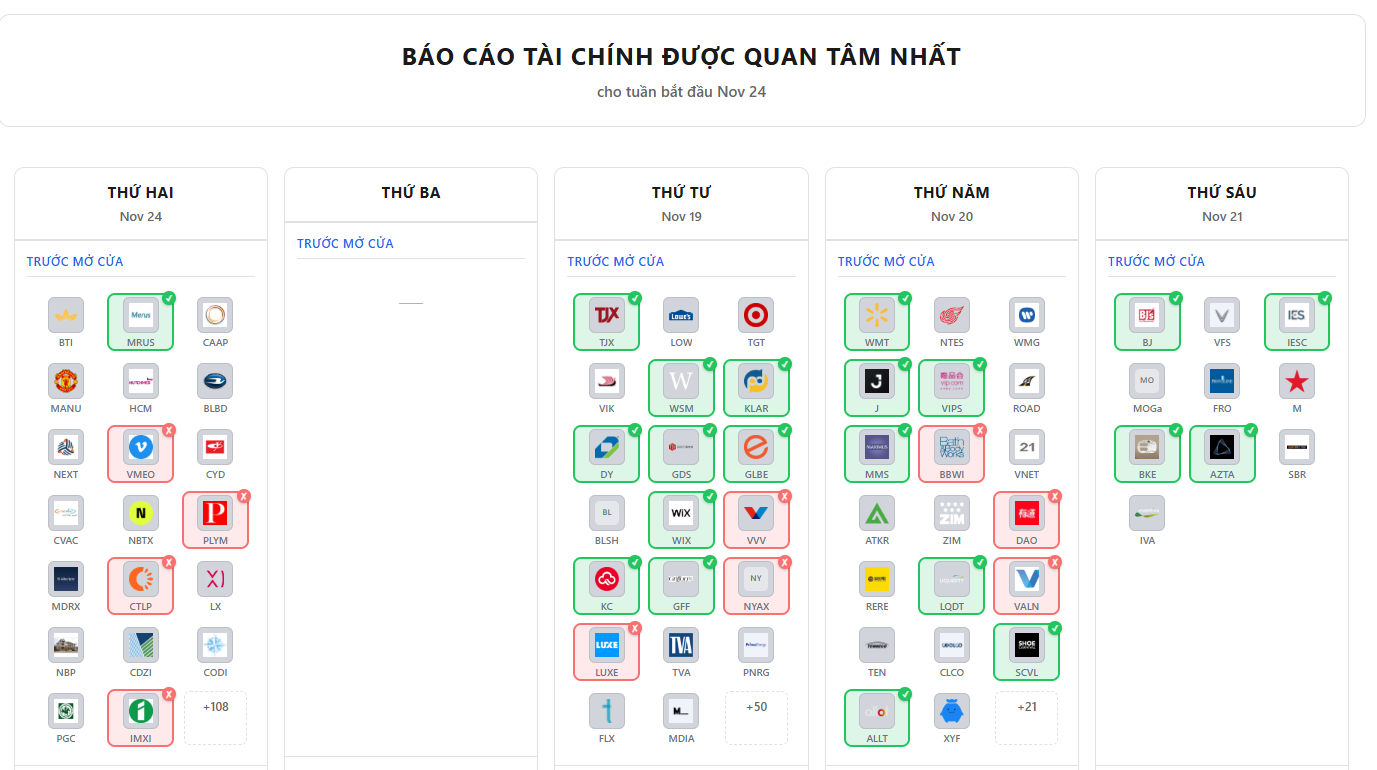
Roadmap:
Updated interface that's easier to use
More accurately marks major ERs that need attention
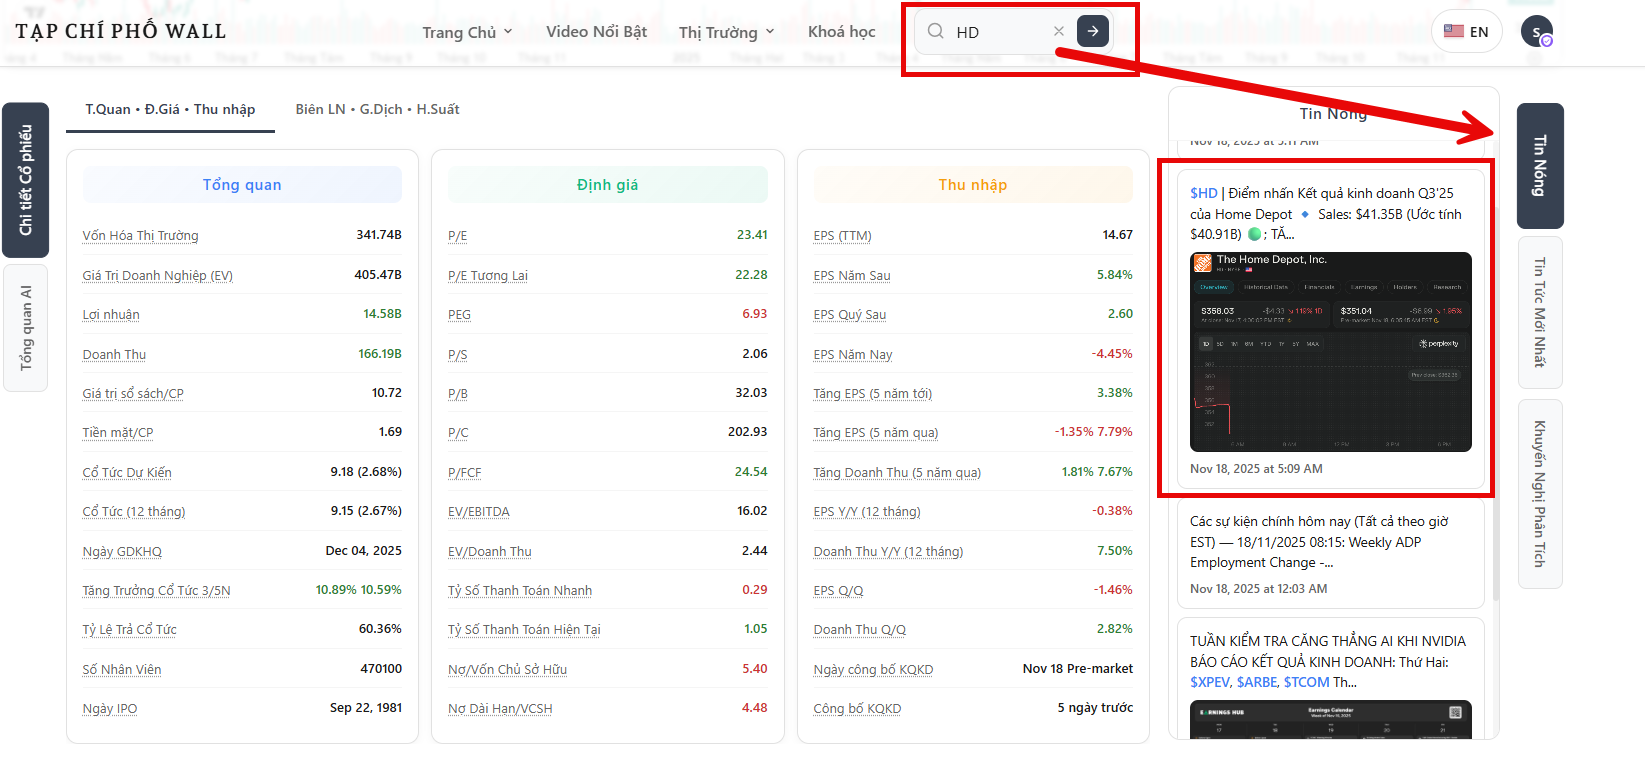
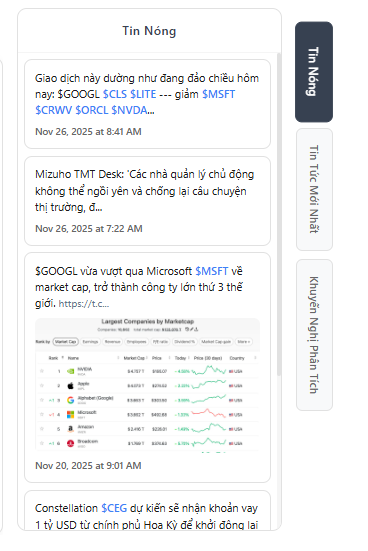
4. Hot news from X
X is probably the most important source of information for retail traders in general regarding the speed of information. However, there are still limitations:
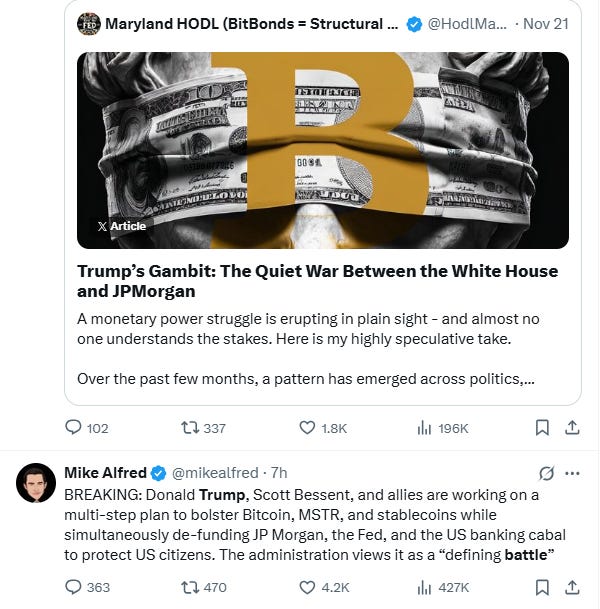
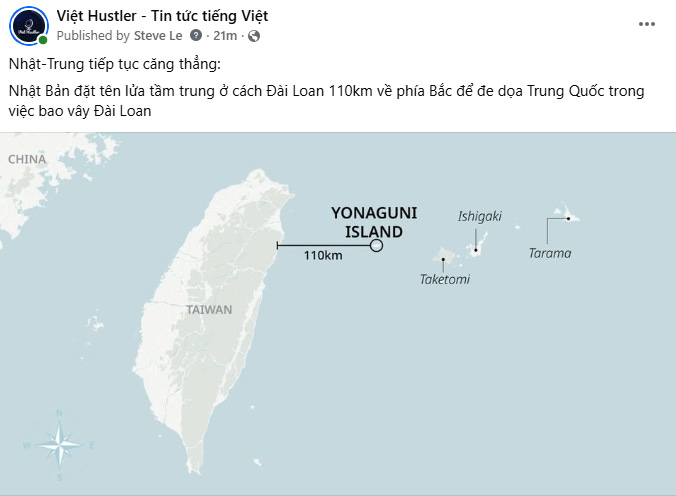
Accuracy, there are a lot of fake news, hype. Investors don't know who to trust
Example: These news have no truth at all, speculation pumping Bitcoin
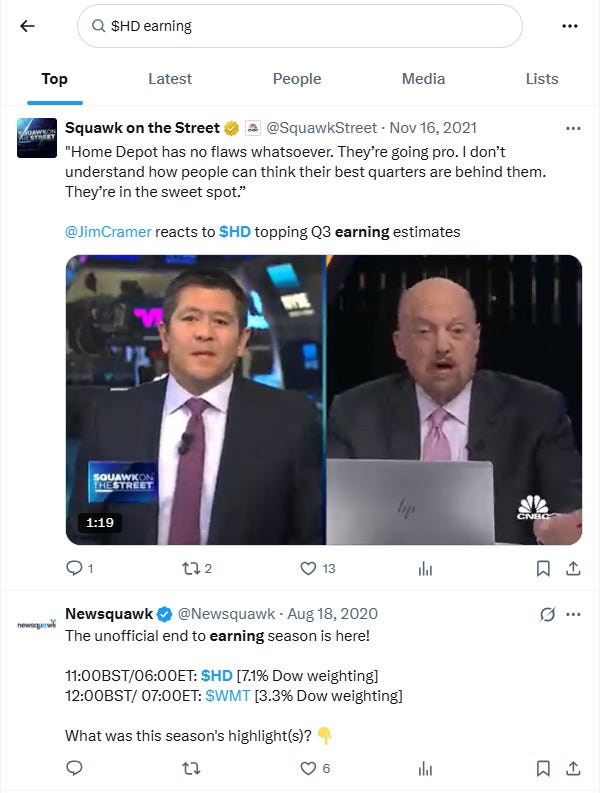
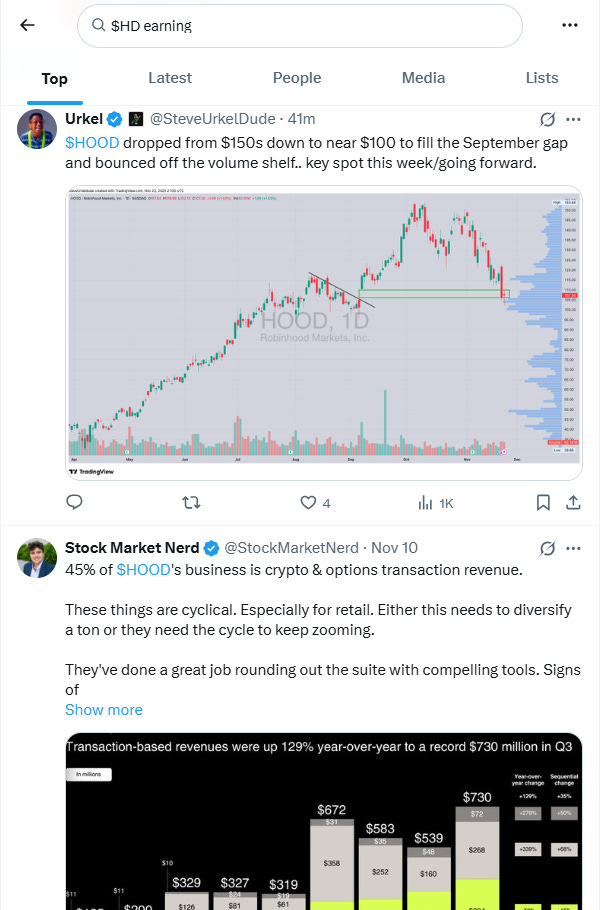
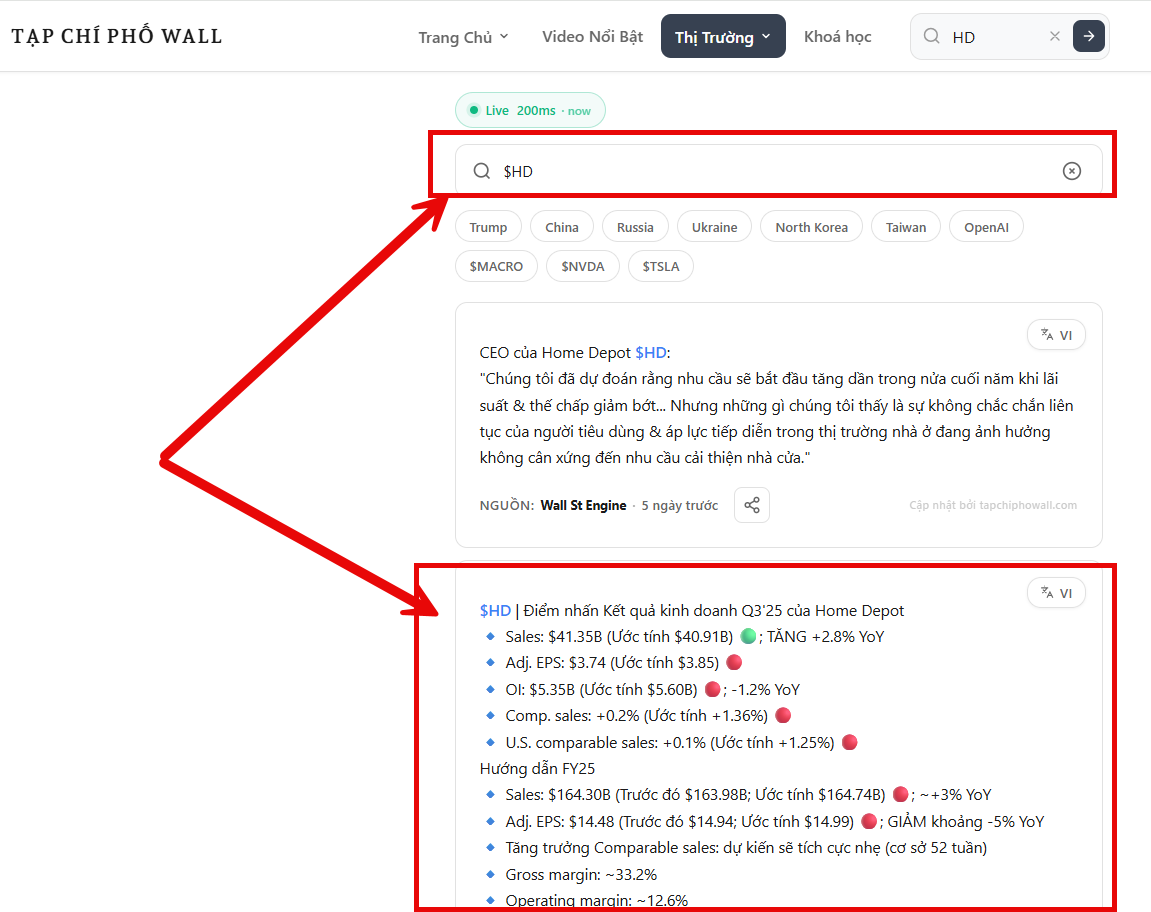
X filter and search are too poor, hard to search for information via keywords
Example: Searching for Home Depot's ER results but getting all news related to
And of course, additionally lacking Vietnamese, Google Translate often wrong
Solutions:
Use API from X, focus on reliable sources
Create custom filters
Link filters to mentioned stocks
Translate English/Vietnamese with AI
Product:
Currently this feature is complete, free and PLUS users can access 5 posts per filter and will unlock all at PRO level
5. Pre-Market News (Expected 01/01/2025)
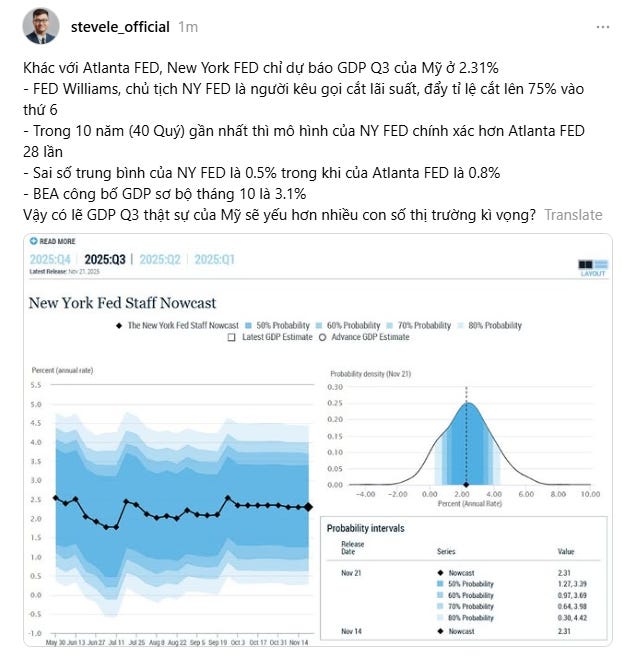
This will be important news at the start of the day before the market opens. Example:
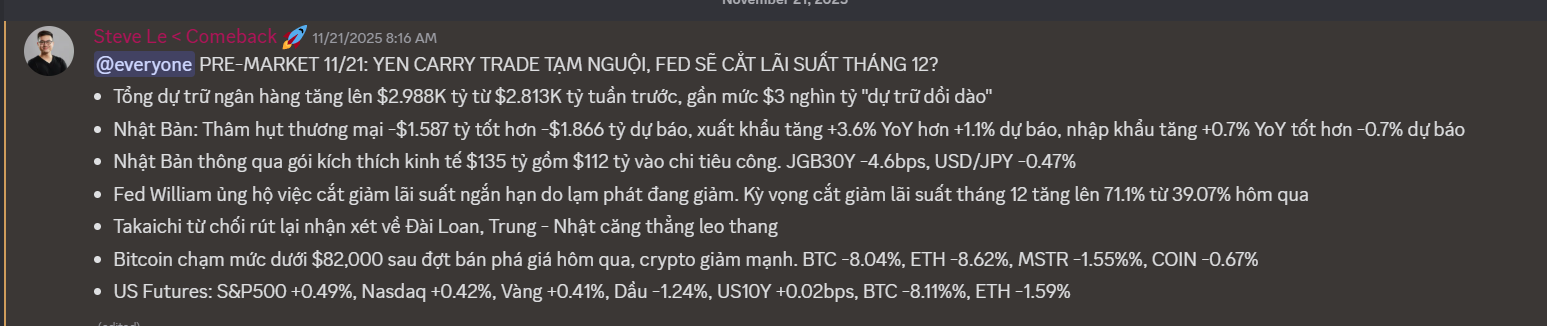
This section will be on the homepage and ready from 12/01/2025. Later, Steve may include some market commentary for the trading session.
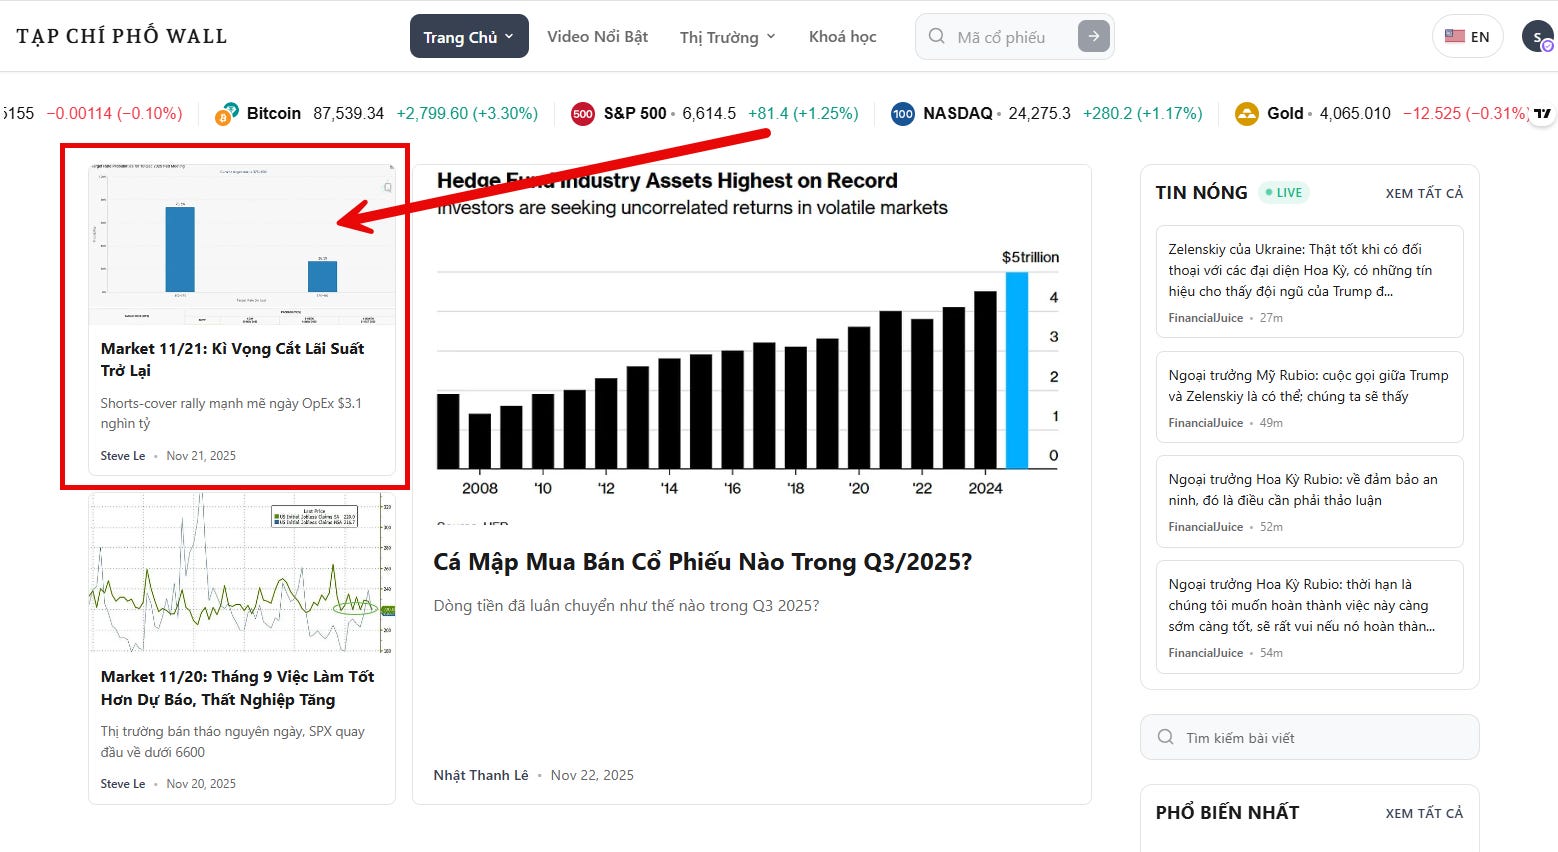
6. Short analysis (Expected 01/01/2025)
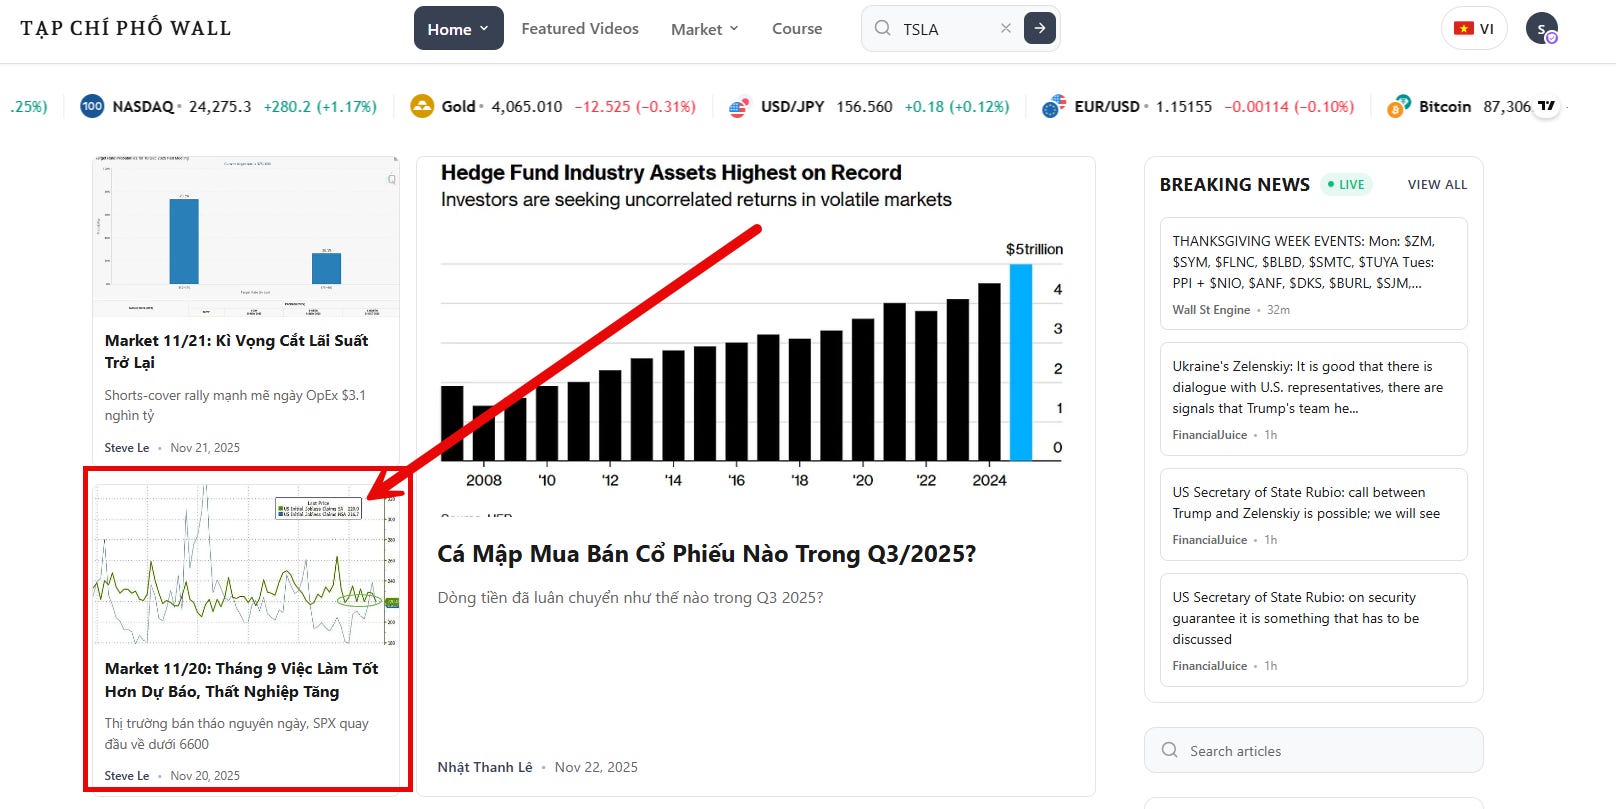
A weakness of the Newsletter model on Substack is that Steve has difficulty publishing short analyses, hot news, or charts that Steve finds noteworthy outside the daily articles. Example:
Later, those short analyses will be put on the homepage with a separate section. Steve thinks it will be combined with section 2) Pre-Market
Expected this section will also launch on 01/01/2025
BLOG #3: FINANCIAL DATA, AI AND RRG CHARTS
With PLUS mainly almost identical to Viet Hustler, the PRO section starts entering new and more important features:
Corporate financial data including trends and ratios
Important hot news
AI models for stock analysis
RRG Charts
1. Corporate financial data
Fundamental analysis is something almost indispensable when approaching any stock. However, there are 2 levels of Fundamental Analysis
Deep Dive (Very deep and detailed analysis, similar to articles on Viet Hustler)
Ratio Check (Quick scan of financial ratios to determine good company/reasonable valuation)
→ This method is what Steve does the most, because the market moves fast, if always waiting for Deep Dive, opportunities may have disappeared. Additionally, in the market, speed is also a separate quality.
If you dig deep into one stock for 1 hour, you may not choose correctly as well as Steve quickly scanning 20 stocks in 1 hour and selecting the best stock.
The Wall Street Journal's Fundamental Analysis tool must serve both 2 purposes.
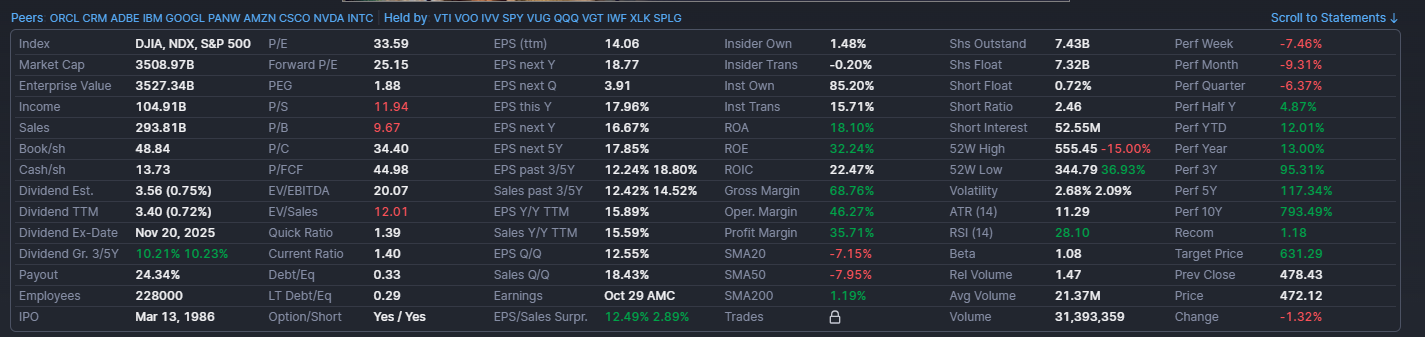
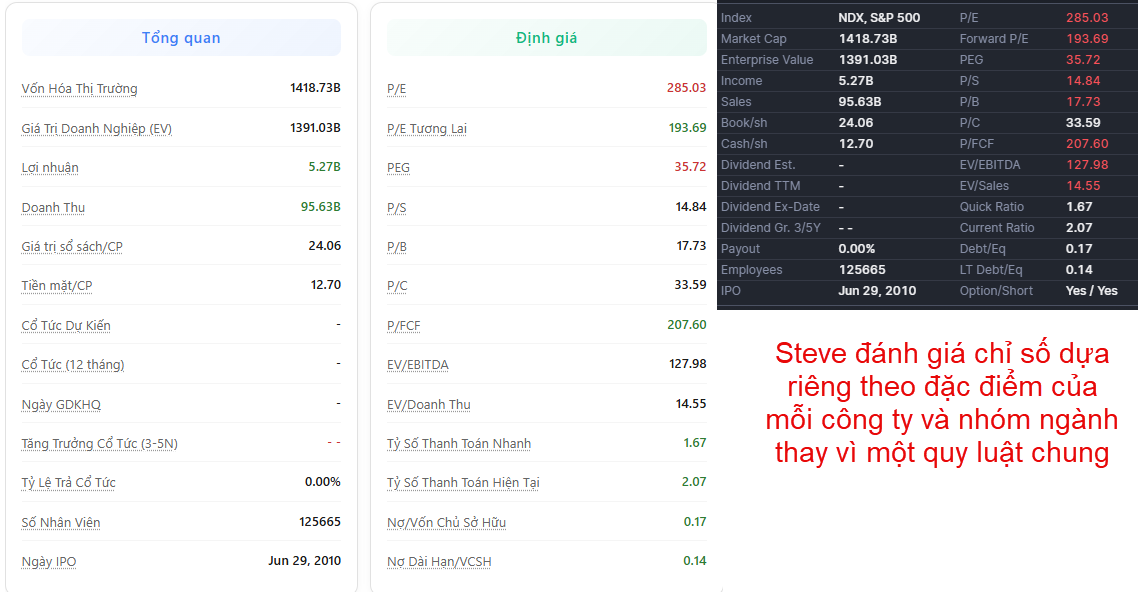
Usually we use Finviz → problems:
Too many unnecessary details
Explanations of metrics are hard to understand
Color-coded (white, red, green) according to general rules for all stocks
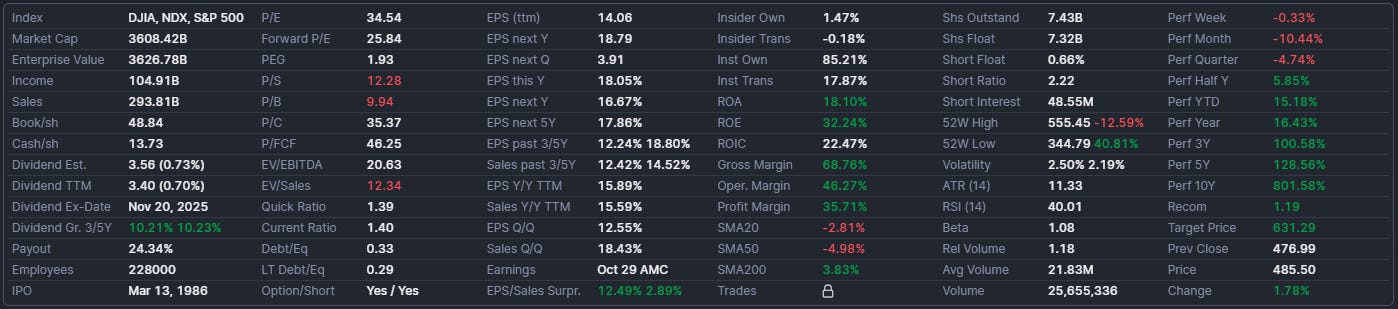
Charts showing trends are limited and focus on little data
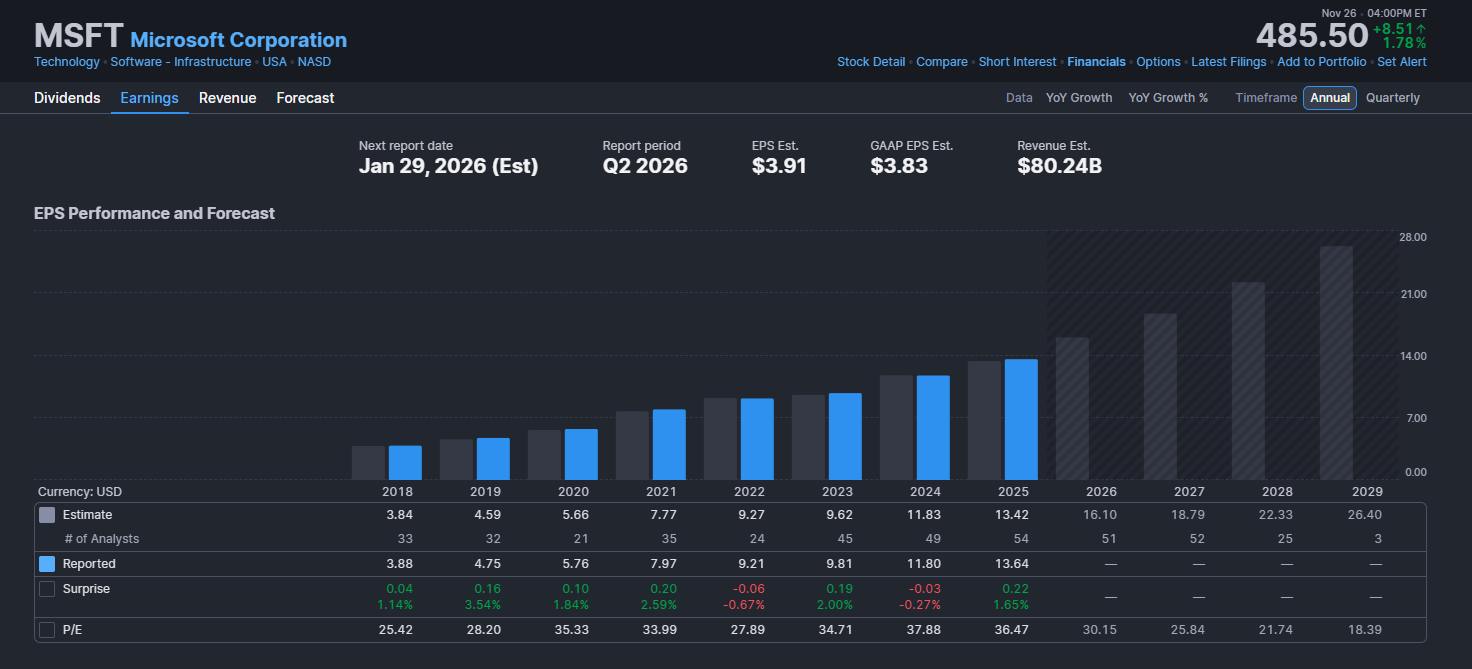
TCPW's approach (of course besides having Vietnamese)
Divide into 2 views: Basic and Advanced
Basic for quick scan

Advanced focuses on more data
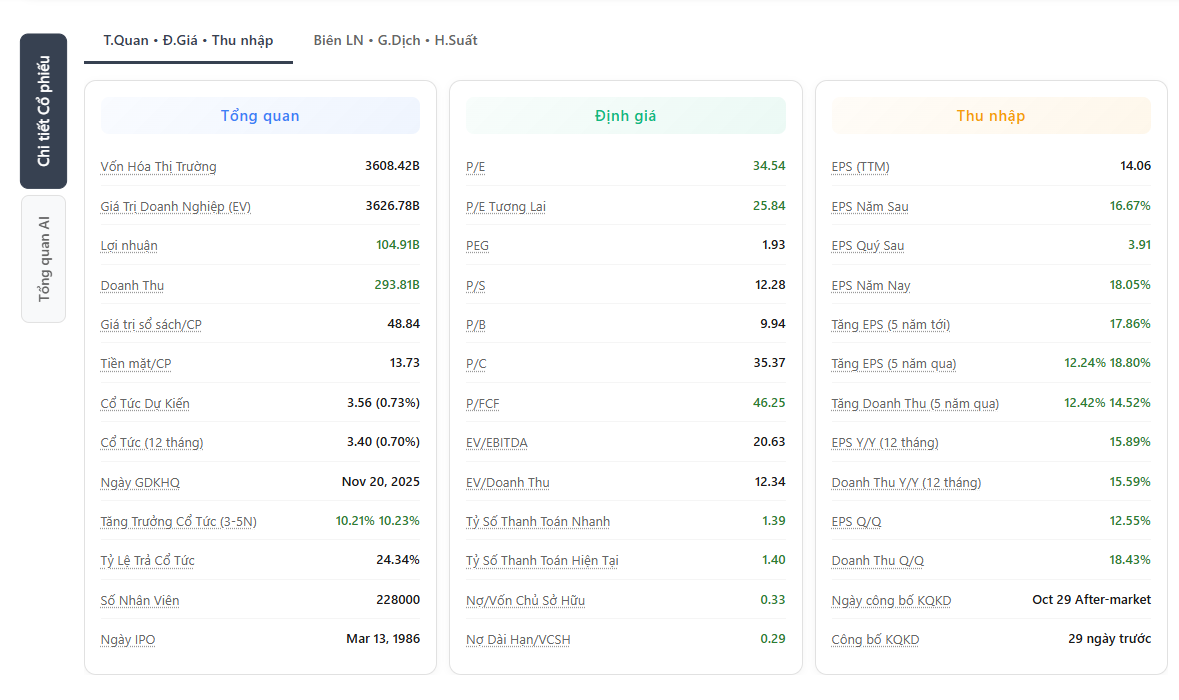
More detailed explanations of the meaning of metrics and what is good/bad
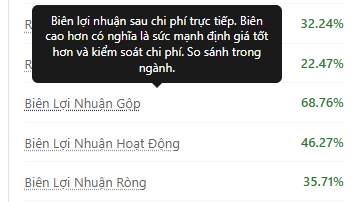
Evaluate metrics according to proprietary formulas
Trend charts of important data, serving Deep Dive
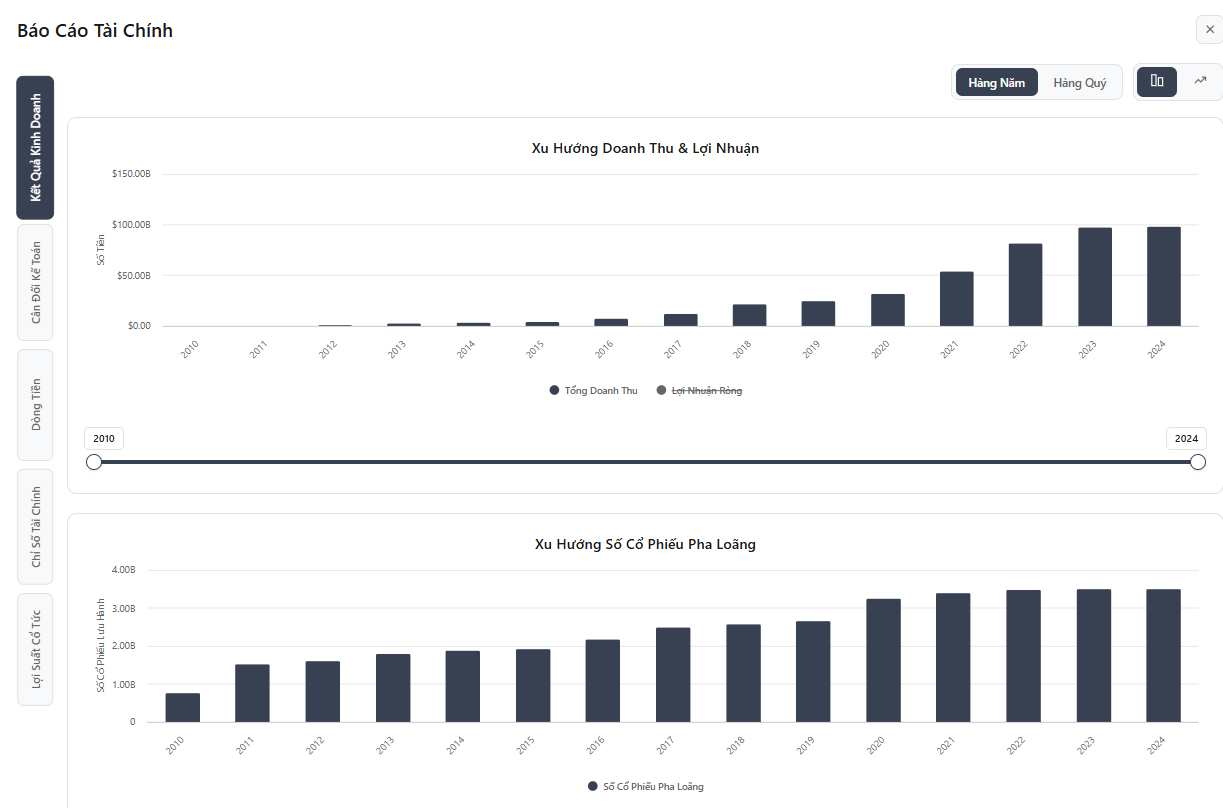
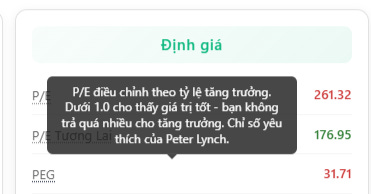
Including important metrics to know if the current stock is called “cheap” compared to before:

Things that will be in the next update:
Add % change YoY and QoQ to the chart to clearly see the growth rate
Add a few important ratios (Margins/Raw FCF/Cash)
Will make the data section even easier to read, highlighting important information
Add a scoring evaluation section, based on surface-level indicators
Usually a similar tool on the market costs at least $35/month, nearly double the price of the entire PRO package.
2. Important breaking news
This section is already available in the PLUS tier but in PRO it's fully unlocked. The news channels have been pre-selected by Steve to ensure accuracy and speed.

Additionally, inside each stock there is additional news:
Easily check new information such as financial reports, instead of having to search on X
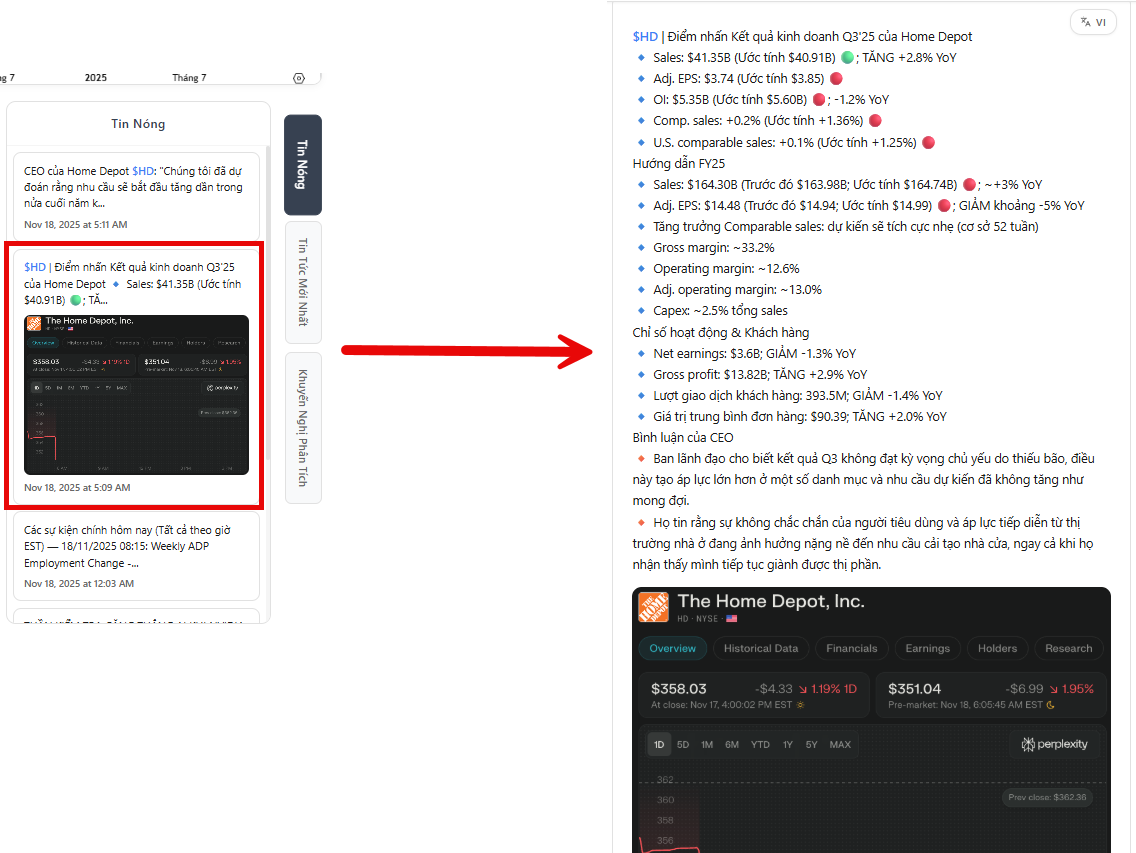
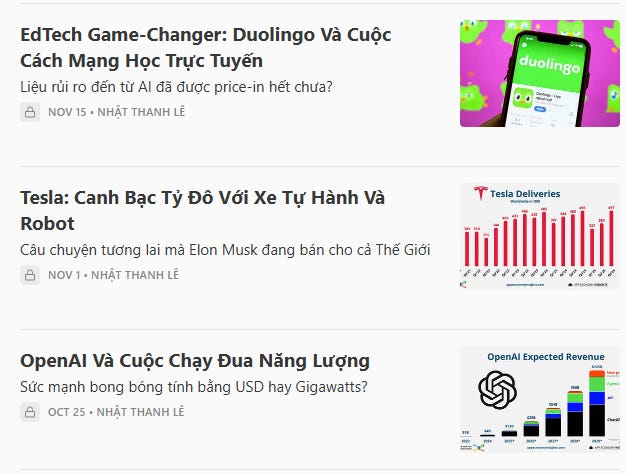
Not only short news, but also important articles:
Wall Street target evaluations and recommendations:
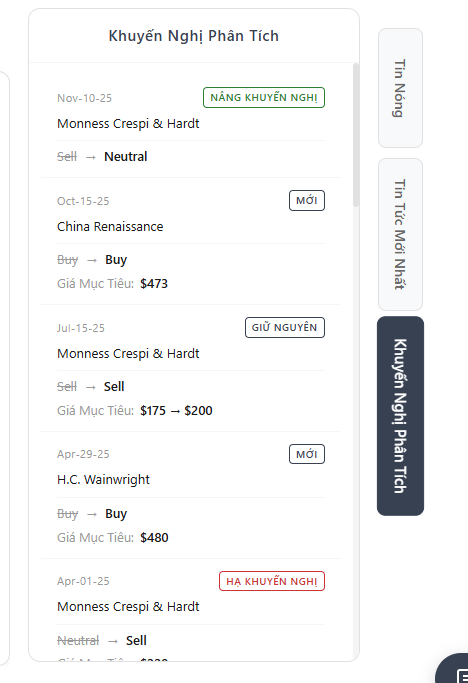
Roadmap:
Will add more reliable fast news sources on X
Better filtering of news articles
More information on Analysts' investment recommendations
AI to read news aloud
3. AI model for stock analysis
After some time trying out various AI models on the market, Steve realized that almost none are good and truly useful for analyzing stocks and making decisions.
Steve won't delve into the training process or prompt building. As usual, Steve identifies the problems other models have (reasons why Steve can't use other models) and finds ways to fix them
AI's strength: Information search
Company overview:
The first essential step in stock analysis, but the one most people skip and other AI services do superficially.
→ The goal is to concisely understand the industry, services, advantages, and products of the company
Risk search:
This is usually the most time-consuming but most important part every time Steve does analysis. Usually AI models do it poorly because they lack inputs to search for information where needed.
→ Steve incorporates his own risk identification method and has back-tested it based on the steps Steve usually takes. An important example is that the AI identified and did not recommend UNH, TTD, ENPH in 2024 with the exact risks that occurred.
Note that Steve's AI will focus more on risks, xaccurately identifying risks 82% and opportunities 62% when backtesting with S&P500 2023 and 2024. Especially Steve's model can independently provide judgments on actions → reactions for each risk (mitigations).
One additional value that Steve uses is cascade value - the potential for risk A to lead to B and then to C (the worst possible things will happen, used to avoid crashes like with ENPH or UNH 2024)
Benchmark:
When valuing stocks, models usually look back at large companies in the industry to compare at similar past points in time, what valuations the big players had. This is extremely time-consuming and AI usually doesn't do it well because it can't identify
Which companies are similar
Which time periods are similar
How the market back then compares to now
→ Steve provides a format to classify development stages for each type of stock separately, then benchmark based on past stages/groups.
AI's weakness: Decision-making
This section is supported by the rule-based approach that Steve often teaches in basic classes or to sellers when doing fundamental analysis applied specifically to the company in each stage and industry group.
→ This is the hardest thing to replicate because if you don't have a system to analyze and approach stocks, how can you incorporate that model into a prompt?
Goals:
Comprehensive company information to accurately understand what the company does
Identify the most dangerous risks (low probability but high impact)
Provide likely development opportunities
Synthesize news, external analysis, and 13F
Have a “conservative” and cautious nature in valuation (tier MAX - Currently for PRO)
Give value-based investment advice (tier MAX - Currently for PRO)
Results (version 1.19 11/20/2025)
Note: The smaller the stock, the lower the AI's accuracy due to lack of information, Steve advises using AI only for stocks with market cap over $5 billion
Difference of AI model between PRO and MAX
In Tier Pro, AI will only focus on providing information to help you decide
Valuation part, % scenario evaluation and investment recommendation will be in Tier MAX
Currently the entire model can be experienced in Tier PRO
4. RRG Charts
A nearly indispensable tool and for Steve the “easiest yet most effective” thing since Steve entered the market, never disappointed Steve and always emphasized in Basic and Seller classes - RRG Charts
RRG Charts show the rotation of money flow across all market sectors through 4 stages so investors can grasp and prepare in advance for each cycle.
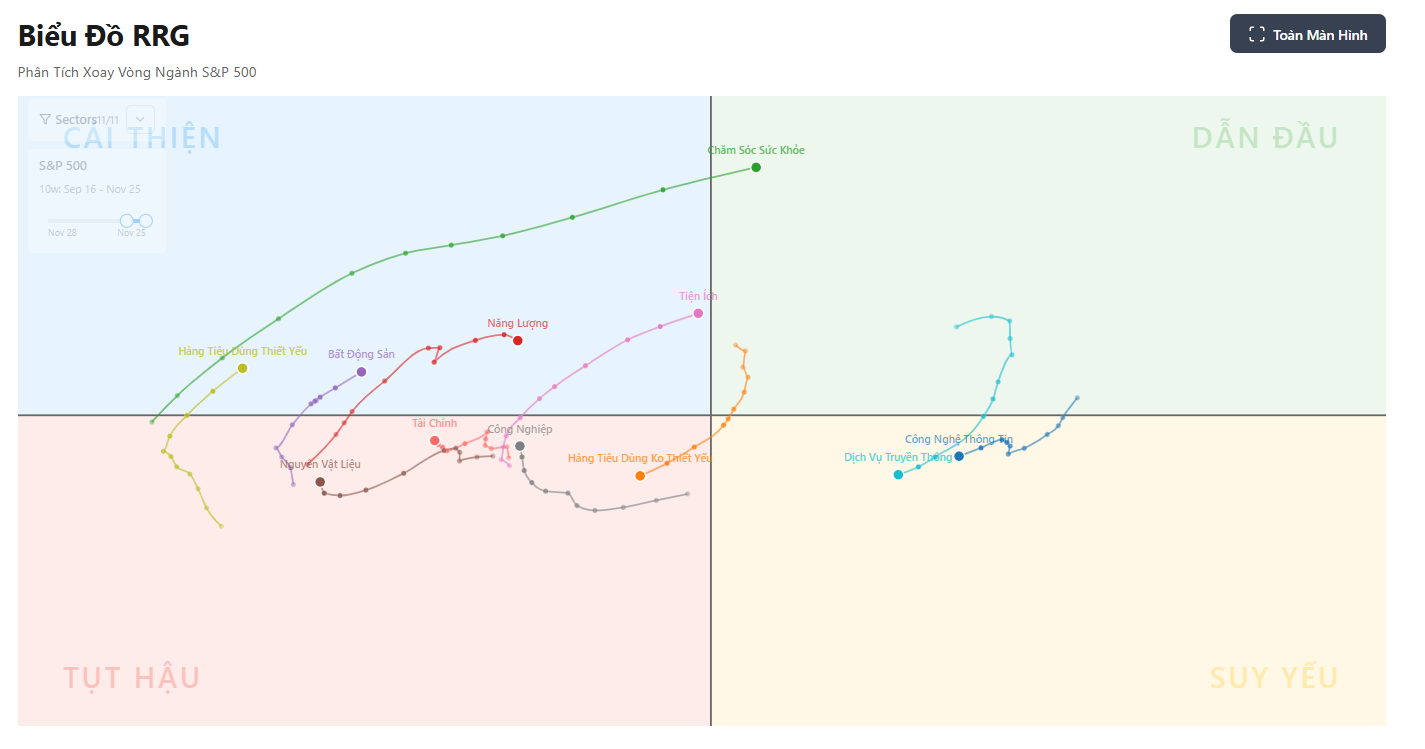
This tool is best used on large timeframes (weekly) and this service is usually $15/month on RRG Online or StockCharts
→ Wall Street Journal does nothing else, just cheaper, includes RRG in PRO.
At a glance, PRO package will offer:
Financial data and charts (Fiscal.ai $49/month)
RRG Charts (StockCharts $15/month)
Breaking news (Benzinga Pro $37/month)
AI (no alternative service found)
→ All for just $6.7/month (annual package) higher than PLUS.
Note: Currently PRO package is priced at $159.99/year, in the near future it will be $169.99/year or $17.99/month
Reason Steve adjusted the price and temporarily moved the entire AI model to PRO package is to expand additional planned services and improve quality before changes, ensuring always providing good value and appropriate pricing at every Tier.
In the next article we will cover the highest Tier MAX with:
Gamma Model (GEX Map)
Volatility Panel
Unusual Options Flow
13F Movement
Congressional Holding
BLOG #4: Options Gamma, Tracking Hedge Funds And Politicians
Today Steve will introduce the highest services in the MAX package:
Dynamic Hedging Information for all index and stock
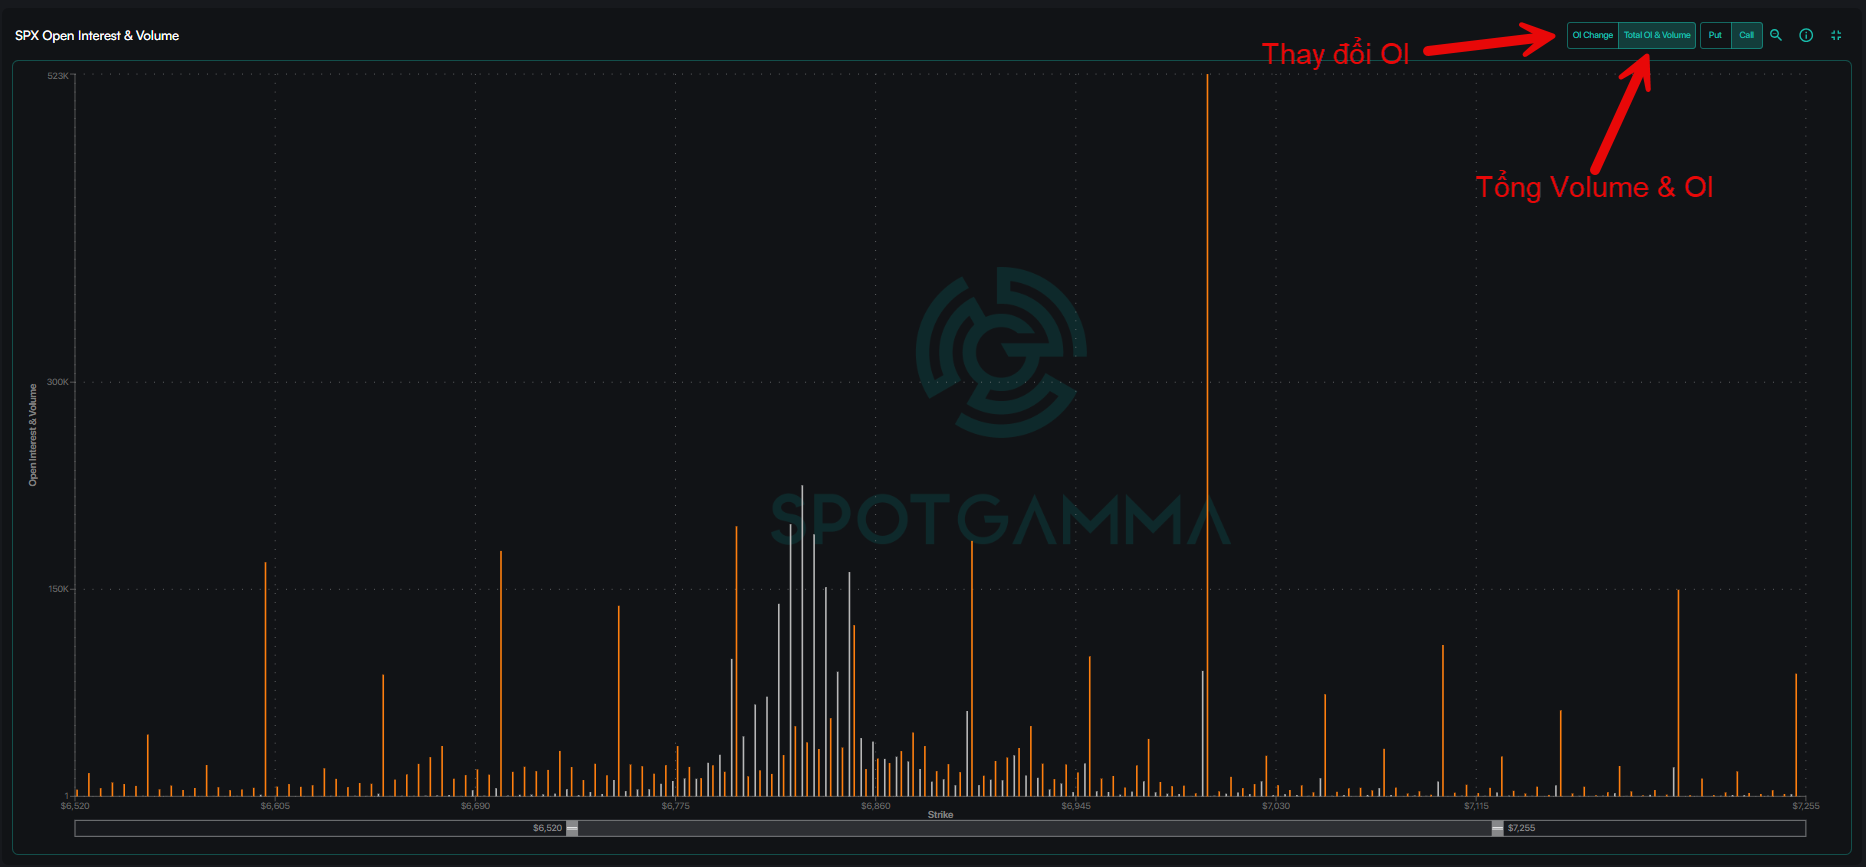
Gamma by Strike
GEX Map
OpEx Concentration
Volatility Dashboard (in progress)
AI upgrade including valuation and recommendations
Reports on buying/selling by hedge funds and politicians
1. Options Gamma
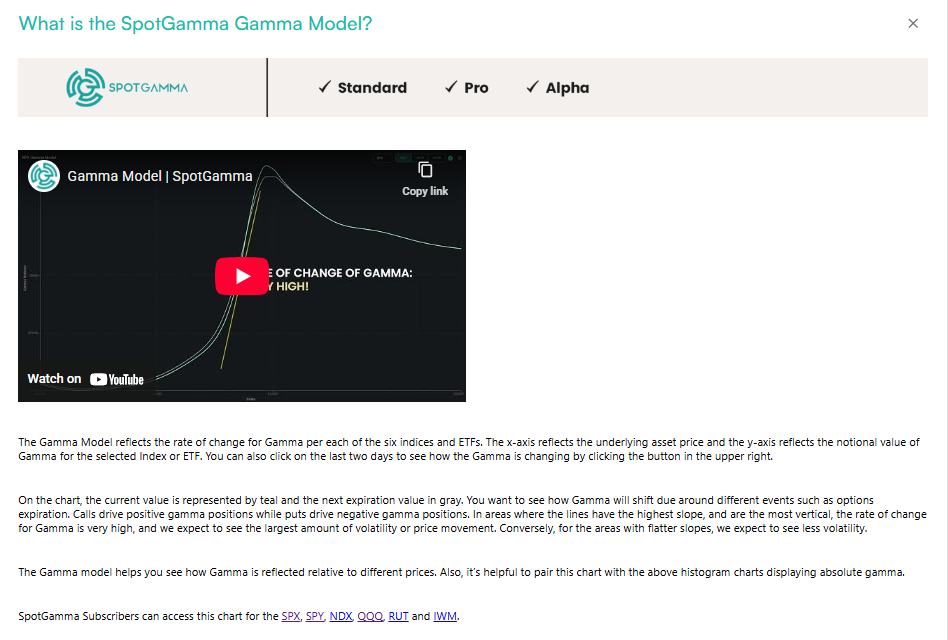
This is probably a quite new area for those new to the US stock market. The influence of options on the equities market itself wasn't really significant until COVID when options volume started exploding → this is when Steve began studying Options Quant.
Options Gamma is already quite familiar to Viet Hustler readers, and is the best tool to identify the large-scale structure in the market.
Most people will use SpotGamma and to view all stocks, you have to select the PRO package which is $129/month → This price is too high
However, there are many tools inside that Steve really feels are unnecessary
→ Steve focuses on creating a basic service, with sufficient functions and more user-friendly for newcomers to the market and especially price only 1/20 of SpotGamma
The MAX package will be higher than PRO by only $6.3/month (Annual package)
If you're not familiar with the options market, you can watch this video:
Then we'll add this video to understand Dynamic Hedging
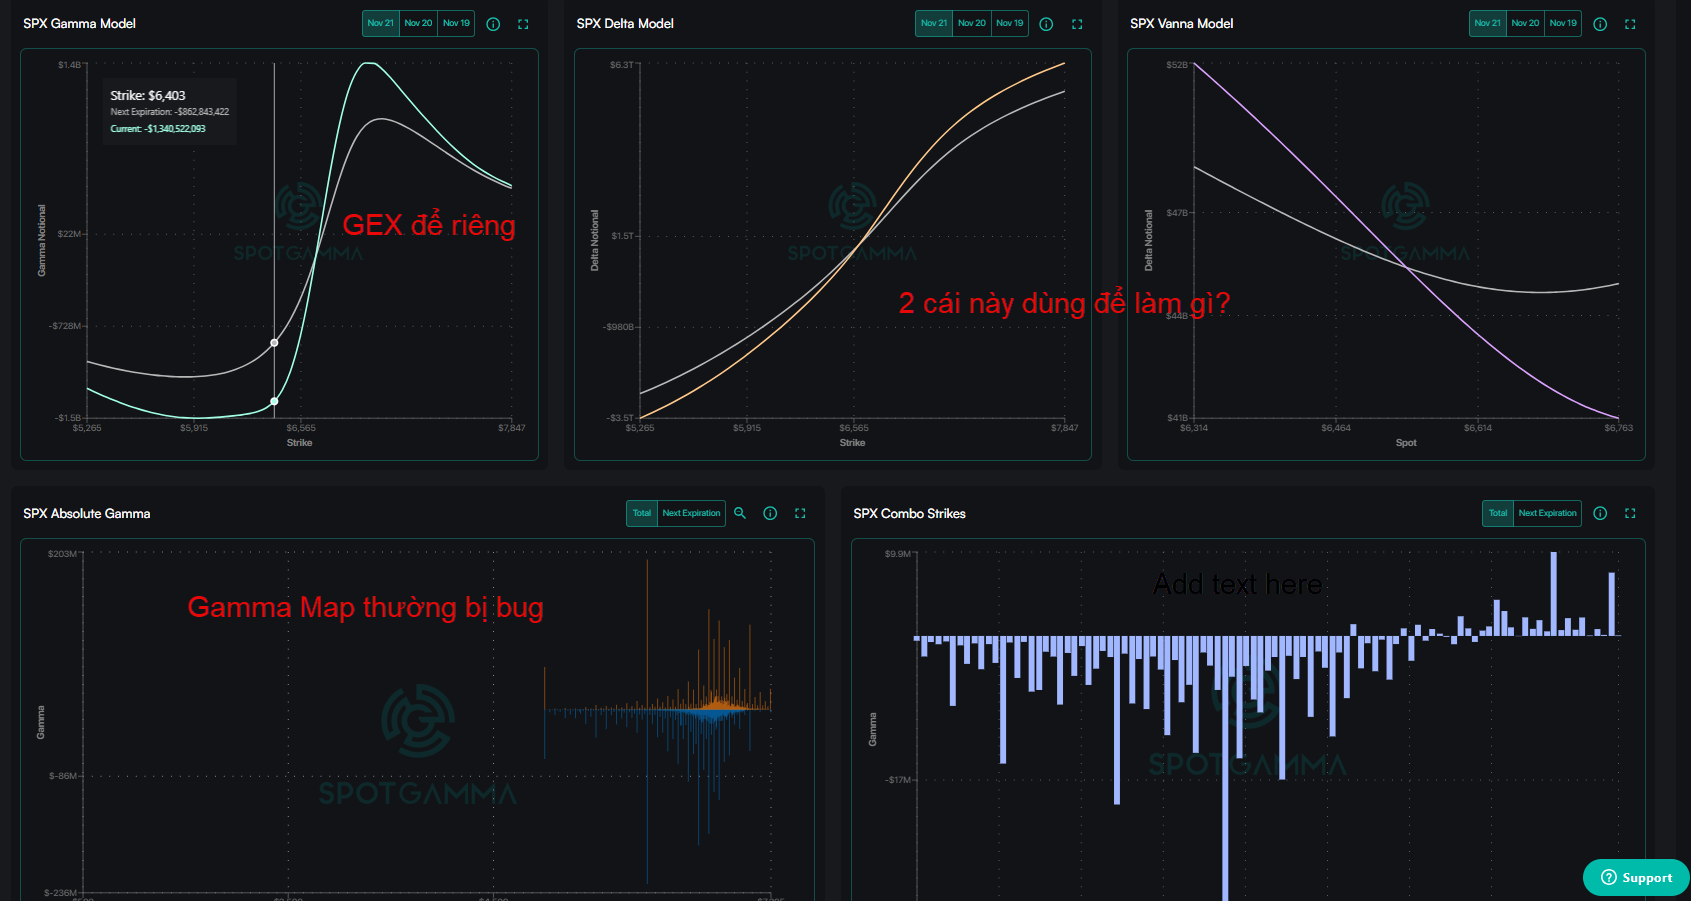
Then the gamma map is the essential thing to visualize the impact of options on the equities market.
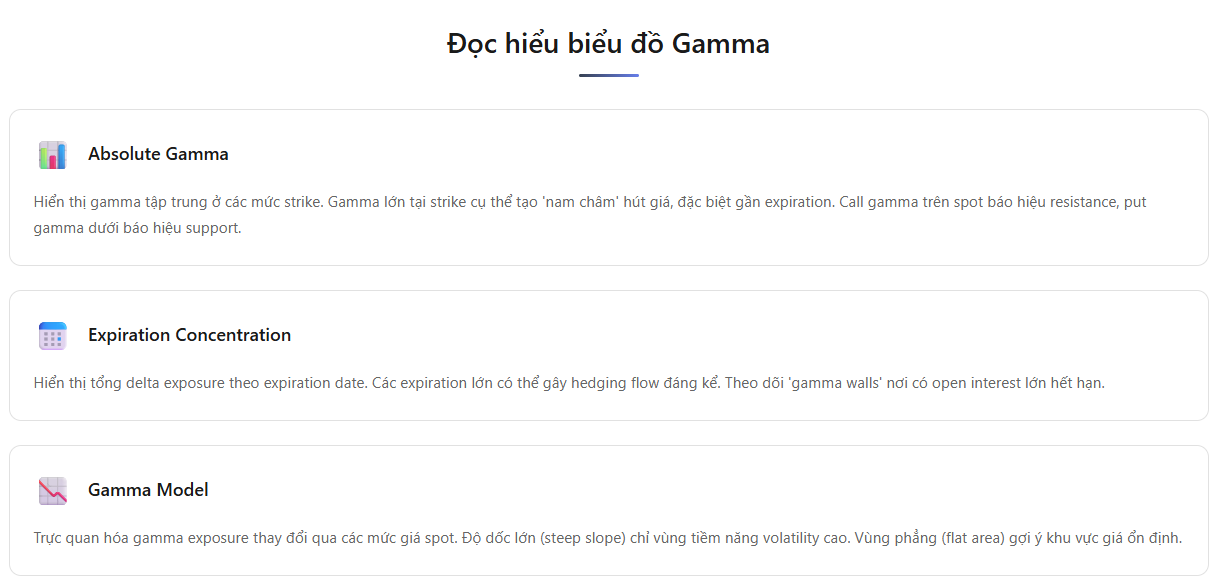
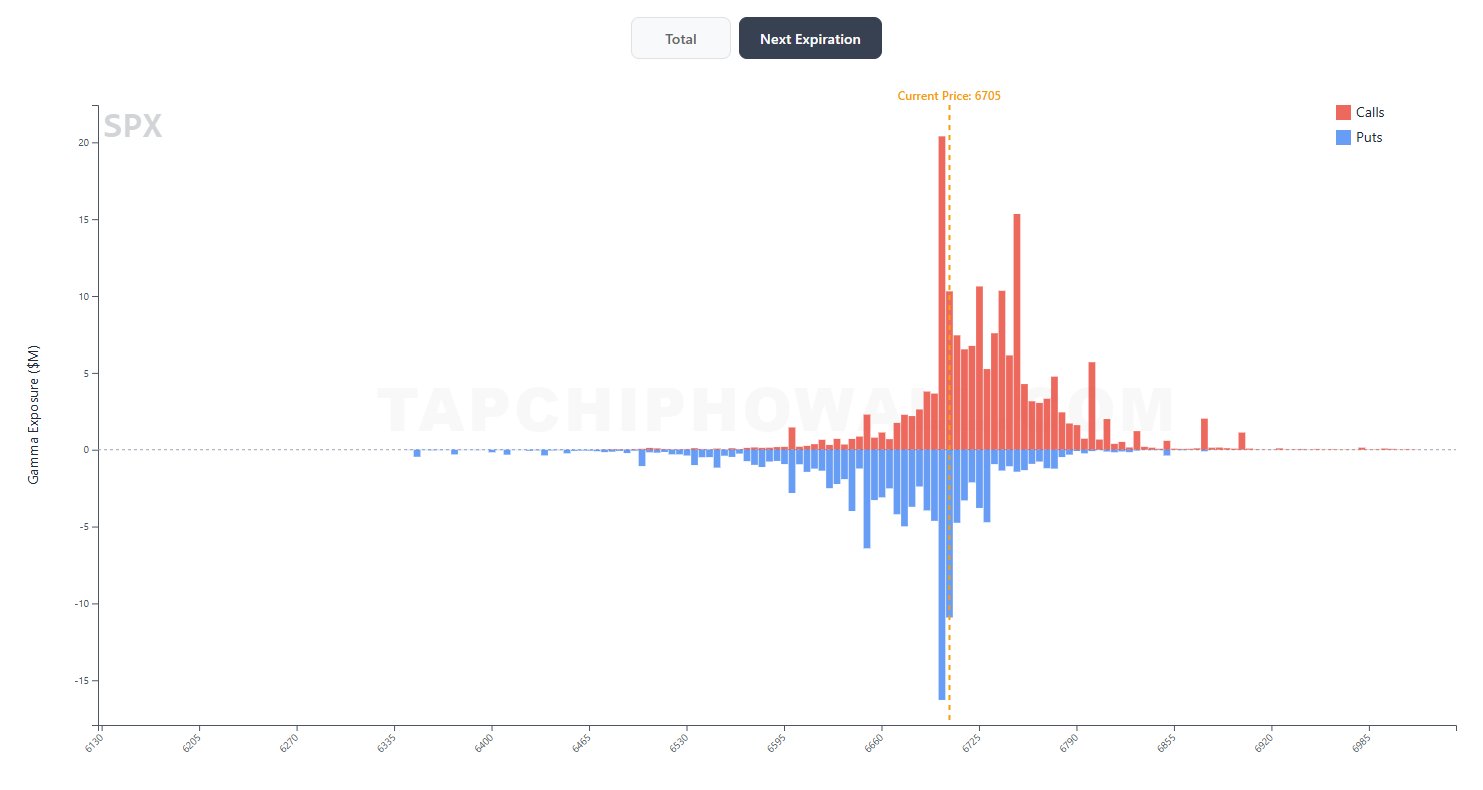
Gamma Map:
Shows which levels have concentrated gamma - these will become magnets attracting or important support/resistance
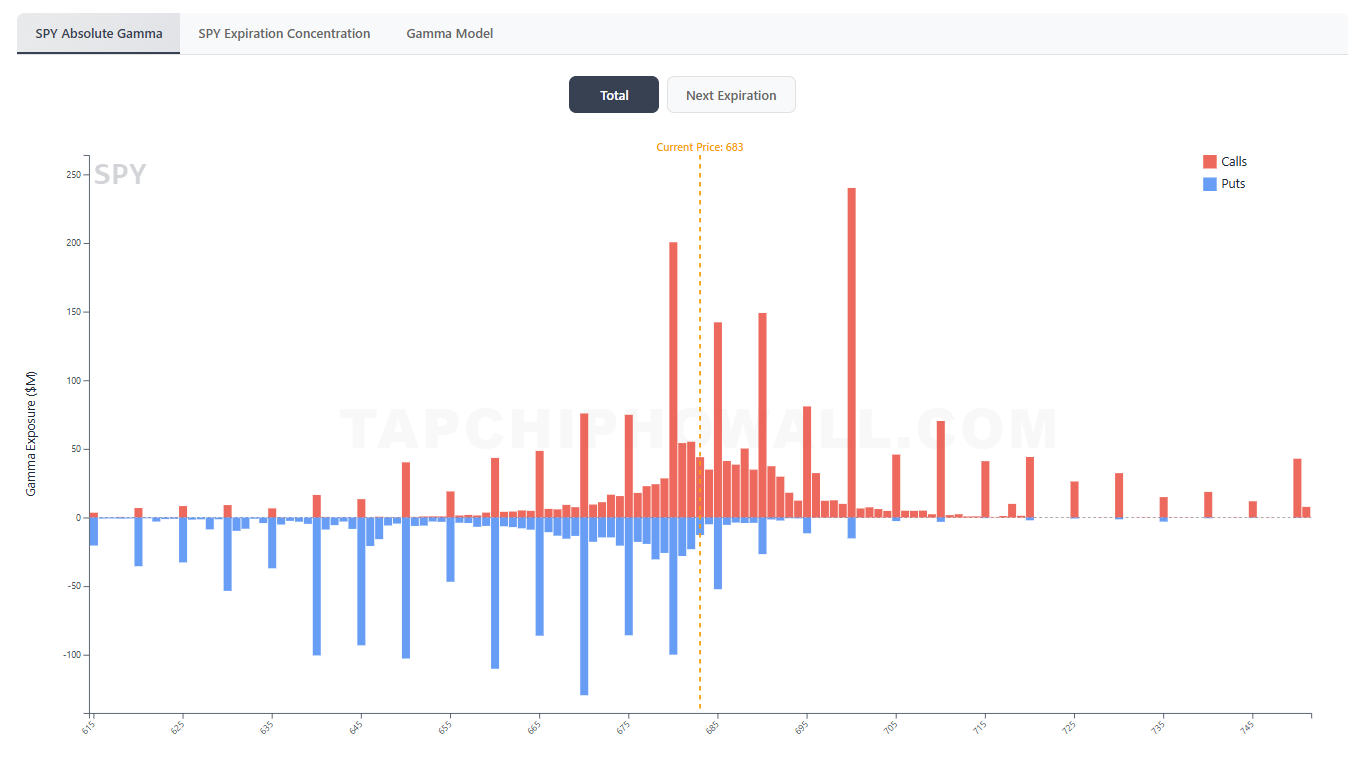
The tactic Steve uses most is through 0DTE flow to daytrade
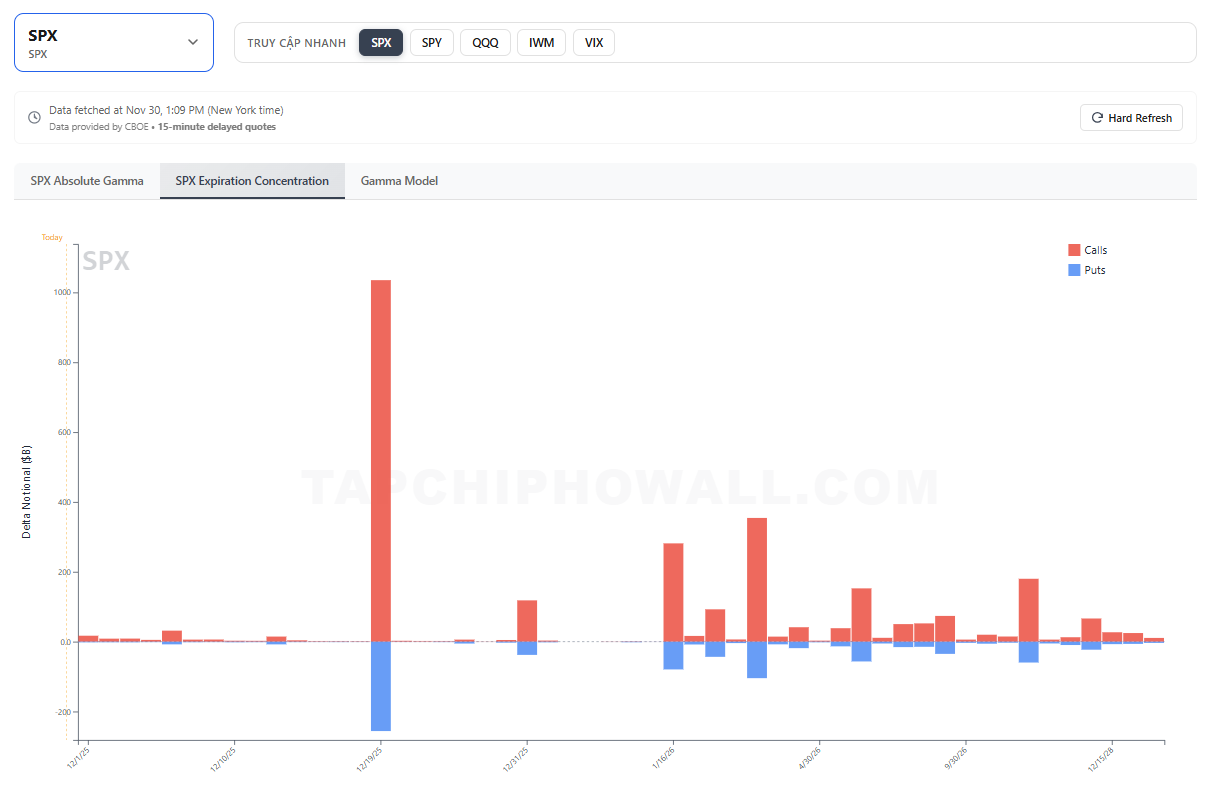
Options Expiration Concentration
Track to know which OpEx has many options expiring → Big impact and high volatility
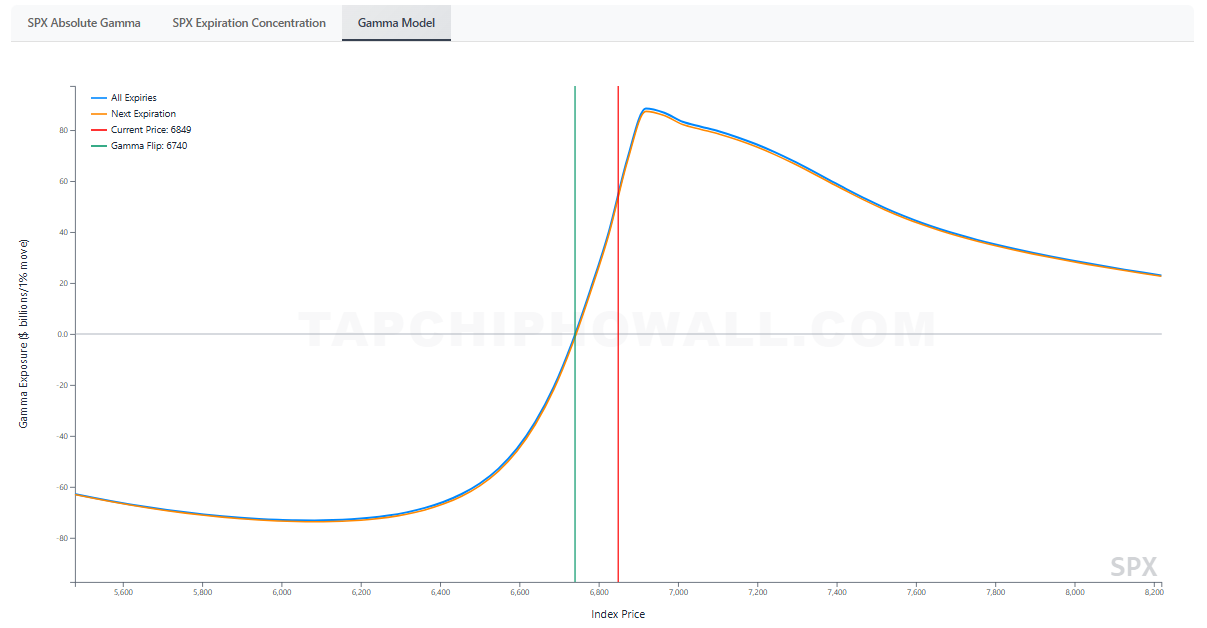
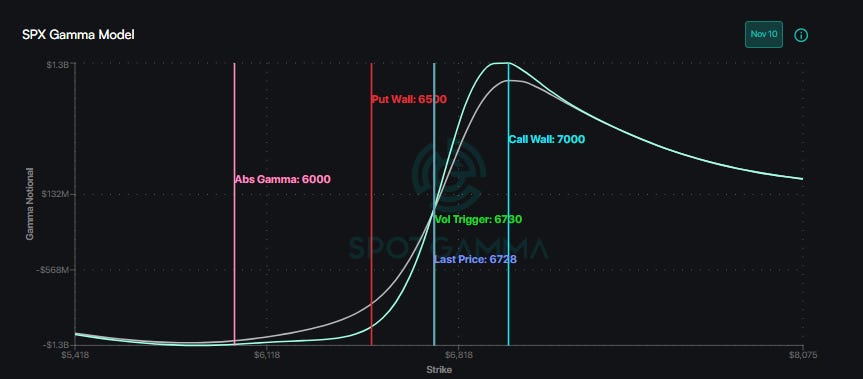
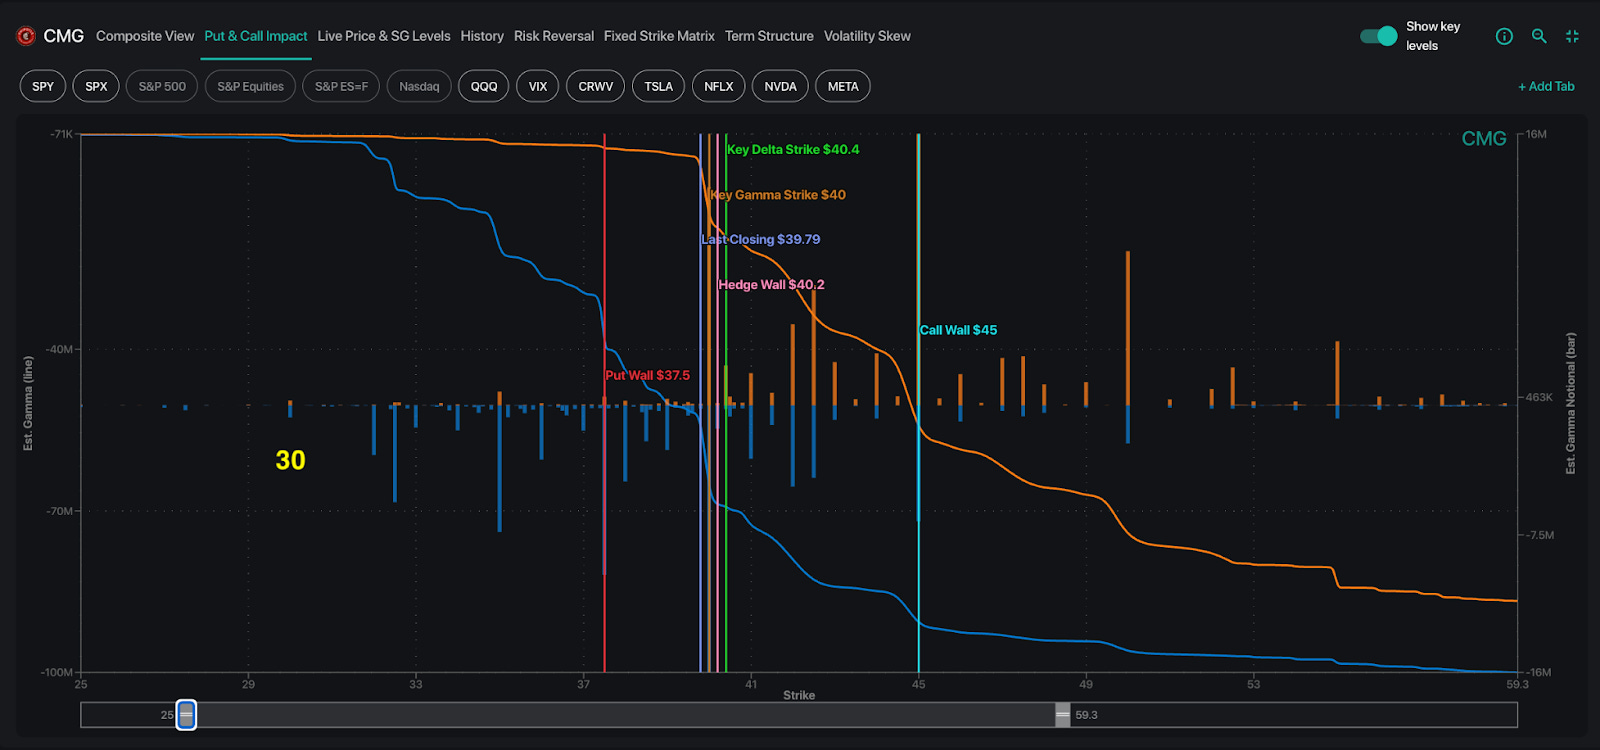
GEX Map
To determine how much $ Gamma dealers will need to buy/sell when spot moves to the point above.
Positive Gamma → Volatility Suppression → Stable market, bullish bias
Negative Gamma → Volatility Inducing → Bearish bias, easy to slip along trends
Gamma Flip Negative → Positive: Market changes bias
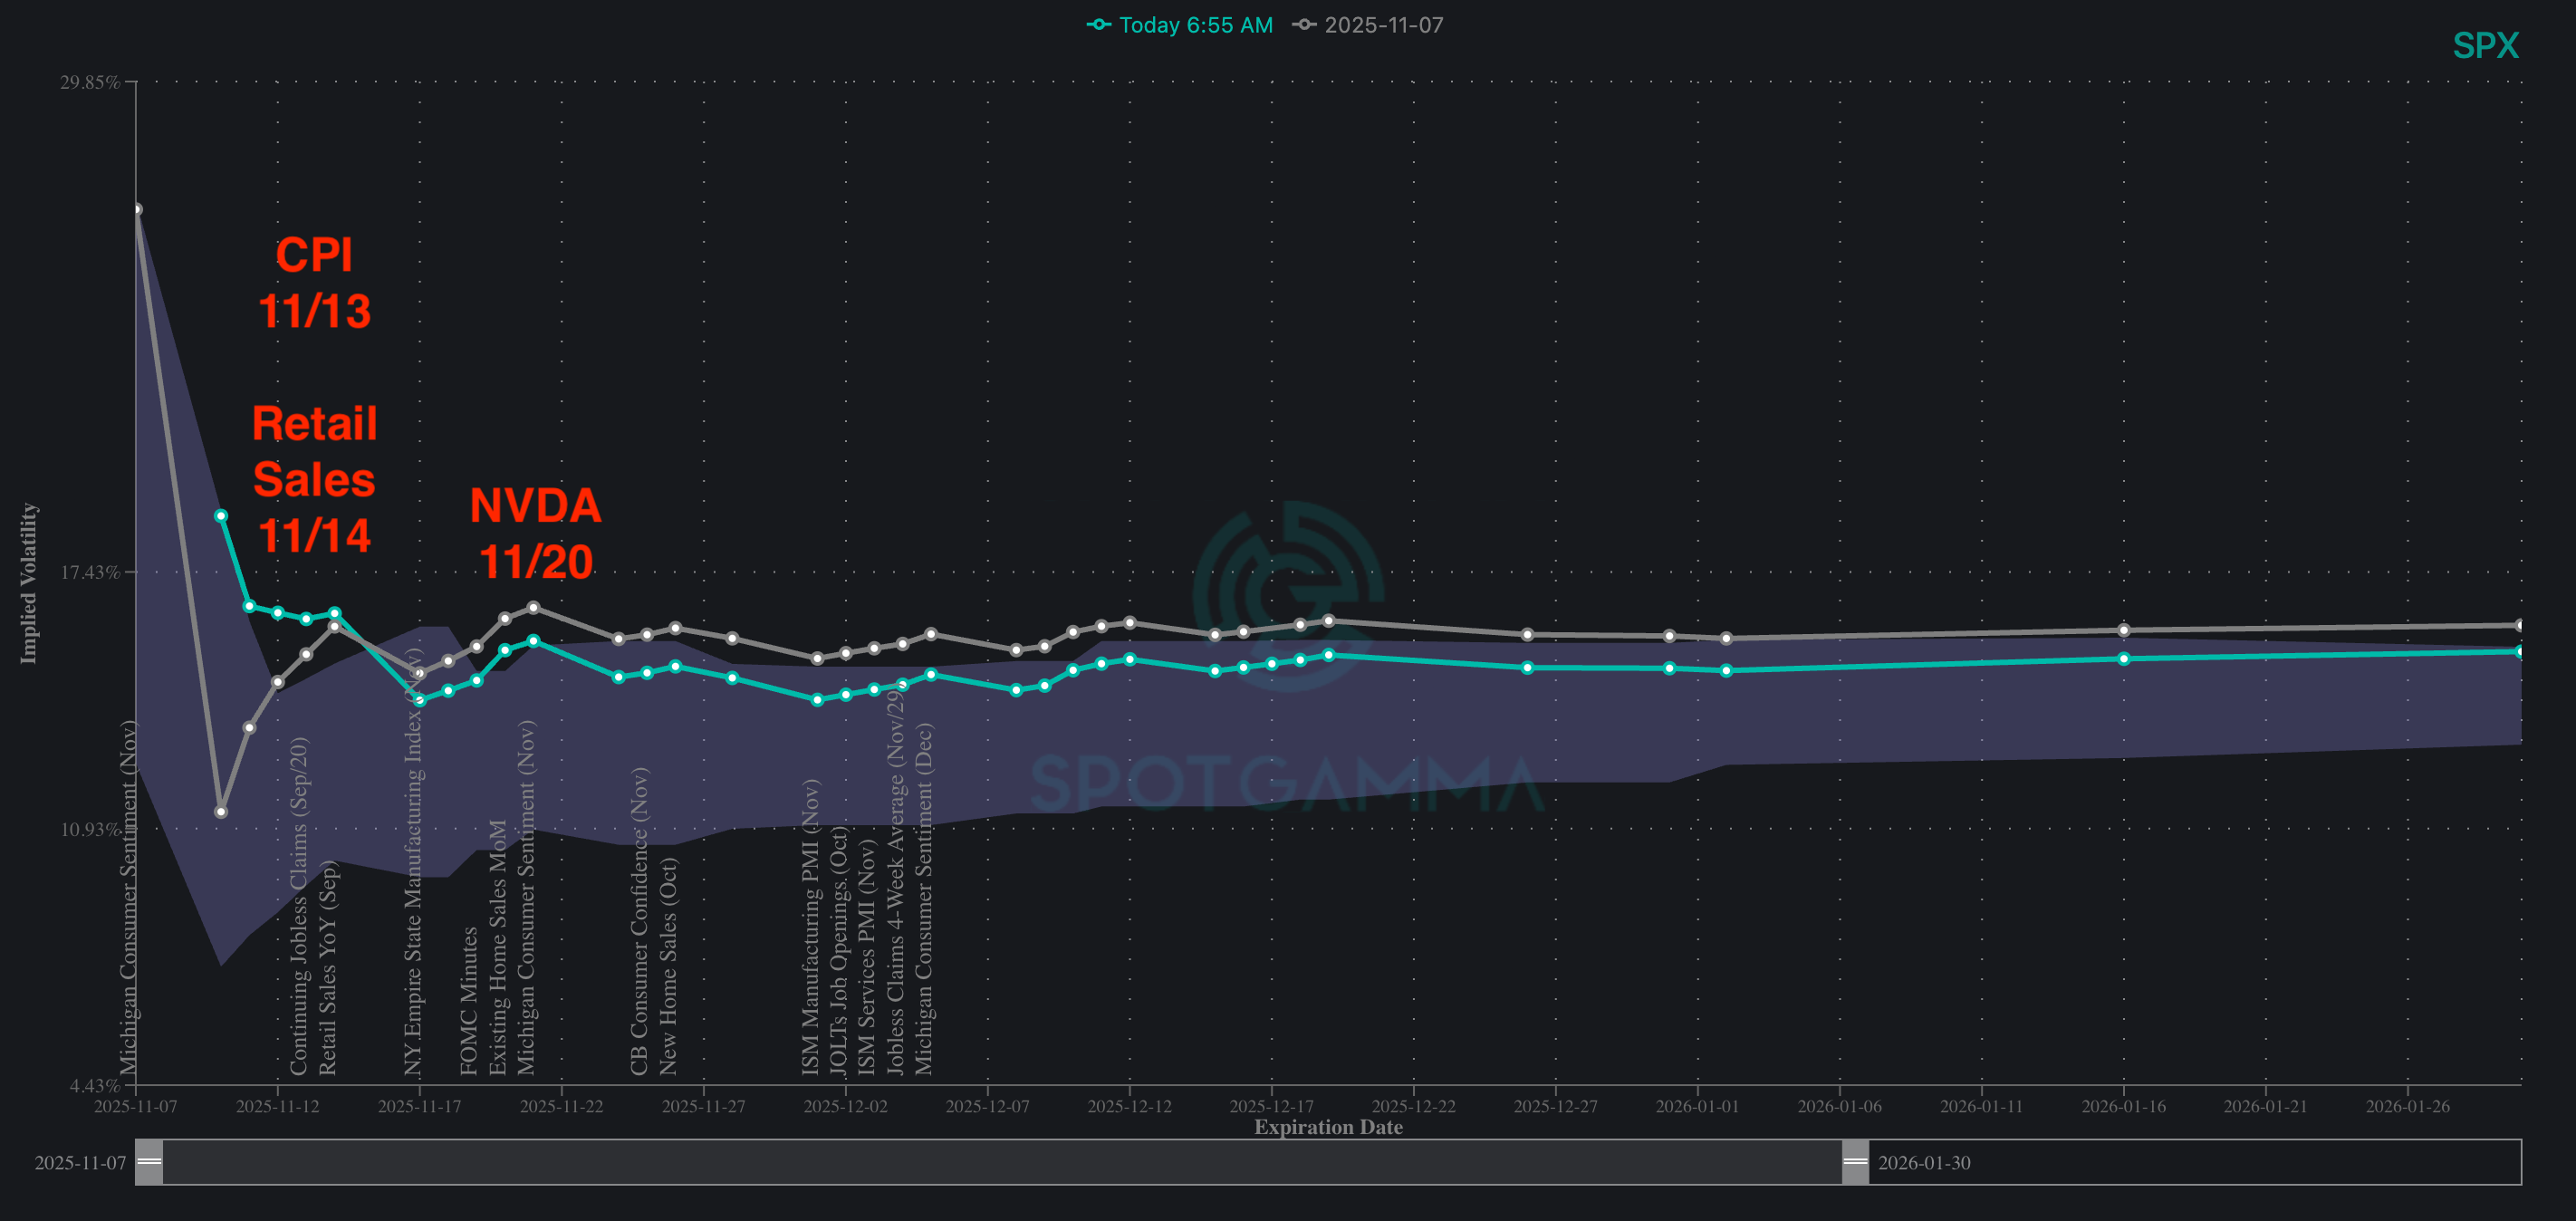
Volatility Dashboard (under development)
To easily visualize the change in IV over time, recognize market expectations for short-term and long-term risk.
Options Change (under development)
To identify daily changes in Volume and Open Interest of options on each stock or ETFs
Can view all ETFs and Stocks
Roadmap:
Mark Put Wall, Call Wall on GEX Map
Allow overlaying GEX Map and Gamma Map
Complete Volatility Dashboard and Options Change
Update more information to explain usage and examples, helping users use this tool more easily.
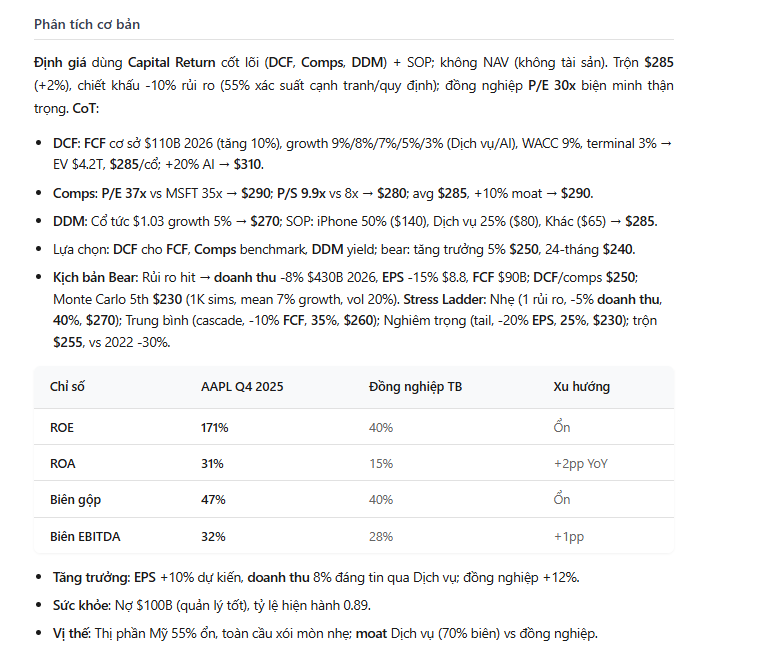
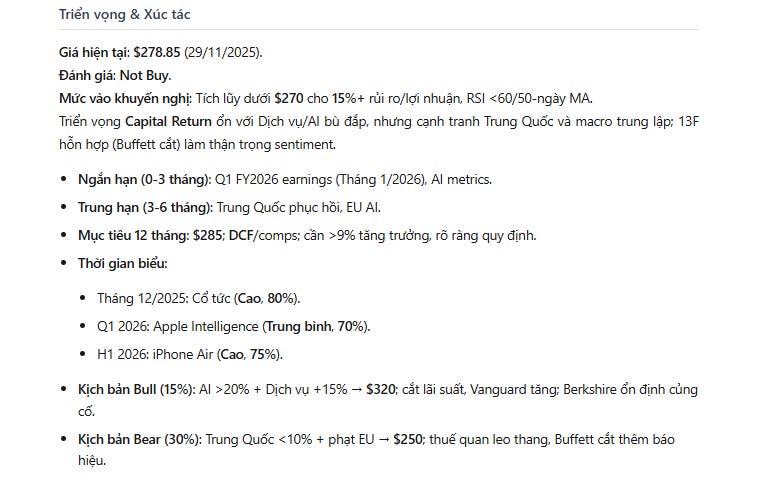
2. AI for valuation and recommendations
As mentioned in yesterday's article about PRO, Steve's AI will be divided into 2 levels:
Overall stock analysis so everyone grasps all important information → Note that this is often the model Steve uses
Use the model to provide valuation and buy/sell recommendations based on stage and business type → For those who want additional reference information
Currently the entire model can be accessed at PRO level, however later the more advanced version will be moved to MAX.
Examples of a few new things in version 2
Hedge Funds and Politicians
Swimming with the sharks is probably the easiest way in the market.
Every quarter Viet Hustler posts an article like this:
However, this is still quite difficult for people to visualize the movement of money flows from investment funds so this will be a tool Steve will expand in the MAX package.
Not only that, politicians with the talent of “predicting contracts” will certainly be an interesting track when Nancy Pelosi in 2024 beat all major hedge funds in the market.
Quote from the draft bill banning congressional stock trading:
“That's not insider trading if the event hasn't happened yet. Buy stocks first, then make the decision for the contract, it's just called a fortunate coincidence.”
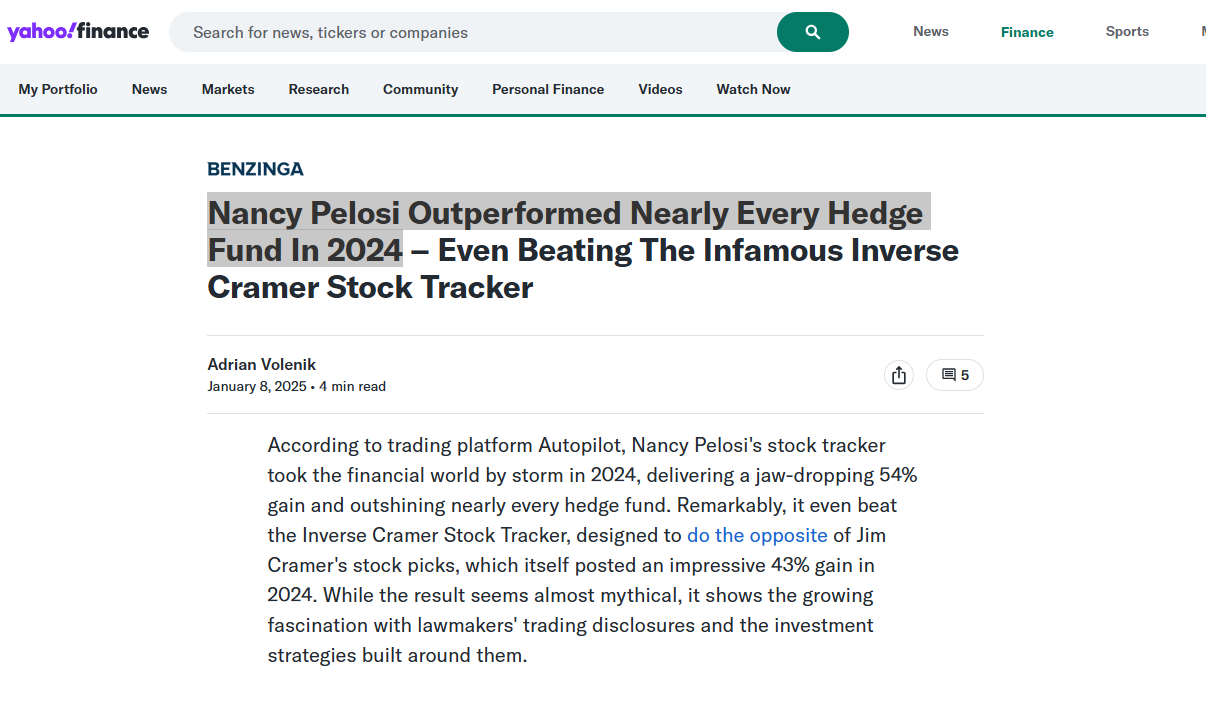
These will be 2 quite difficult trackers to make and Steve will have to leave them for last.
This is all the current and planned services of Tạp Chí Phố Wall. Steve hopes you will support and help Steve speed up the completion process of the planned tools so everyone can use them.
Currently, Steve has written up all the new changes in the Wall Street Journal.
Note: Steve cannot automatically transfer everyone's accounts from Substack to TCPW, so everyone:
Message Steve on Substack, Discord, or email steve.le@viethustler.com that you want to transfer
Steve is sending Wall Street Journal coupons with the unused money from Viet Hustler Substack (instead of issuing pro-rated refunds)
Steve will cancel everyone's auto-renew accounts on Substack
Everyone will use the coupon and self-register a new account on TCPW at https://tapchiphowall.com/pricing-plans
Thank you everyone for your support!